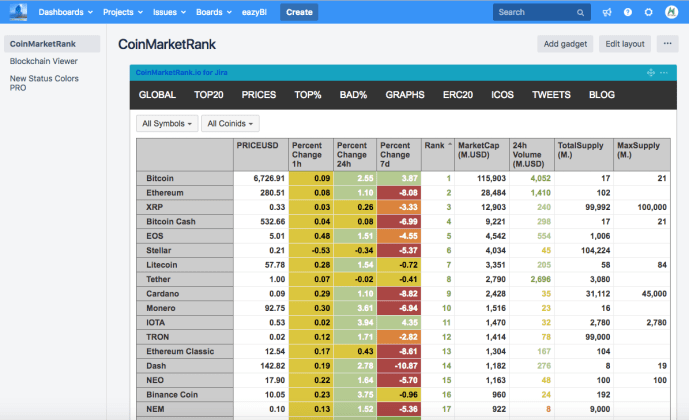
The new version of eazyBI 6.4 provides us with new functionalities that can be very useful and that we want to highlight in this post, such as: Conditional formatting on bar, line, and timeline charts.!! (here more info) Use conditional formatting in charts (bar, line, timeline) to highlight individual bars, ranges, scatters, or bubbles. 2.…
Read MoreAvatar in eazyBI like in Jira Boards
eazyBI is very powerfull in a lot of aspects since version 6, you can use “MarkDown” for show your information with a very impressive style. Did you try to show the Jira Avatar in eazyBI? Yes! It can be done. Create the following measure (set as MarkDown in text format): And you will see the…
Read MoreBeautiful Markdown now in eazyBI 6.1.1!
September has arrived and we have a new version of eazyBI too. This version (6.1.1) is magnificent, since it includes the most required feature on the planet, this is adding Markdown to eazyBI. Yes finally! It is my moment! Let’s see what improvements it has: Report Specific Measures Now you can define calculated measures only…
Read MoreNew eazyBI 5.3 feature: Drill into a single measure by another dimension level
This new amazing feature is available for eazyBI for Jira Server and Jira Cloud. Here the official documentation Drill into measure (column) by another dimension level (example: Time) To cross join only one particular measure with a particular dimension level, you may use option Drill into: click on the measure, select Drill into and the dimension…
Read MoreHow to mix Excel file with Jira data using eazyBI
In this exercise of the eazyBI training we want to mix the content of an Excel file with our Jira issues using an Account/cube of the one of the most famous plugins for Business Intelligence and Analytics for Atlassian Jira called eazyBI. First we need an Excel file of course, we will use a column…
Read MoreDiscover the incredible posts by Fabio Genovese for the Deiser blog. Jira Profields and eazyBI stories.
Fabio Genovese part of the MrAddon team and well-known as Artigiano del Software is collaborating with Deiser creating incredible stories about how to use Jira with Profields and eazyBI. Highly recommended to read! Jira Project Reporting Academy 1: Setting up the flow of data from Profields to eazyBI Jira Project Reporting Academy 2: Creating your…
Read MoreEstrenamos blog en español de análisis del mercado blockchain e IOT basado en CoinMarketRank
En el blog se analiza a diario el mercado de las criptomonedas como Bitcoin, Ethereum, Ripple, IOTA y sus posibles futuras soluciones para el dia a dia de la gente normal. Se intenta dar pronósticos sobre futuras criptomonedas candidatas a los rankings de CoinMarketRank TOP200, TOP20, TOP PRECIOS, TOP% en ganancias, BAD% en perdidas, Gráficos, etc. ENTRAR EN COINMARKETRANK ENTRAR EN EL BLOG from Ankonan.io
Read MoreHow to calculate “Lead Time” or “Real Average Resolution Days” with eazyBI and JIRA (Part II)
This post is the continuation of: How to calculate “Lead Time” or “Real Average Resolution Days” with eazyBI and JIRA The eazyBI team has suggested me a new improved version of the post, the reason is because when we use in rows the dimension Time ( using for example monthly aggregation) the formula doesn’t work…
Read MoreA simple tip for eazyBI
As I wrote in others posts, both in MrAddon and Artigiano blog, eazyBI is the best tool inside Jira to to Business Intelligence. However, I think some practical features are missing. Let me explain Copy a report As show in following figure we cannot copy a report, but only: Rename Move to Export definition Delete…
Read MoreOs presentamos el nuevo curso oficial de eazyBI for JIRA.
eazyBI es una potente solución de BI que le permite recopilar, analizar y presentar datos de diversas fuentes, como Jira, repositorios Git, bases de datos, puntos finales REST e incluso hojas de cálculo de Excel. En este curso, aprenderá los principales principios subyacentes de eazyBI, como las conexiones de origen de datos, las cuentas de…
Read MoreThe power of eazyBI for Crypto Analysis
What is eazyBI and what it’s for eazyBI is a powerful visualization and analysis add-on for Jira Server and Jira Cloud. With eazyBI you can create custom reports, charts, and dashboards with an easy-to-use drag-and-drop interface. eazyBI can be used no only for Jira but for any other data sources We can import standard or…
Read MoreHow to create a Heat World Map in Jira with eazyBI
In this example, we want to explain how we can create a Heatmap (Worldmap) using eazyBI (in this case for Jira). As prerequisite we need a CSV with at least 3 fields: one for the ID of the row and other two fields for the longitude and geographical latitude. We need a special dimension for the…
Read More