What is eazyBI and what it’s for
eazyBI is a powerful visualization and analysis add-on for Jira Server and Jira Cloud.
With eazyBI you can create custom reports, charts, and dashboards with an easy-to-use drag-and-drop interface.
eazyBI can be used no only for Jira but for any other data sources
We can import standard or custom fields from Jira Software, Jira Service Desk, and most popular 3rd party add-ons like Tempo Timesheets, Zephyr, Xray, Profields, and others.Import additional data from external data sources like SQL databases, REST API, Google Sheets, CSV or Exel spreadsheets and include this data in your Jira reports. eazyBI also supports easy data import popular from web applications like Basecamp, Highrise, Harvest, Zendesk, Git, and Freshbooks.

With eazyBI we can do pivot tables!
Use the drag-and-drop interface to build interactive and easy-to-use pivot table reports and charts: table, bar, line, area, pie, scatter, timeline, map, Gantt, or gauge charts. Explore different chart options with an instant feedback. Drill into details or across other dimensions right from the chart to identify your top and bottom performers, trends, patterns, opportunities, challenges, and risks.
…and Calculated Measures with Javascript and MDX
Use many eazyBI predefined calculated measures or define your own specific calculations using powerful custom calculation formulas based on MDX query language.
We can use also Javascript to calculate dimensions and measures during the data importation.
We can publish eazyBI reports and Dashboards not only in Jira!
We can publish eazyBI reports as gadgets on Jira dashboards or Confluence pages or embed your reports using <iframe>.
For example in Mobile Apps,

and Websites, it’s very easy with eazyBI!

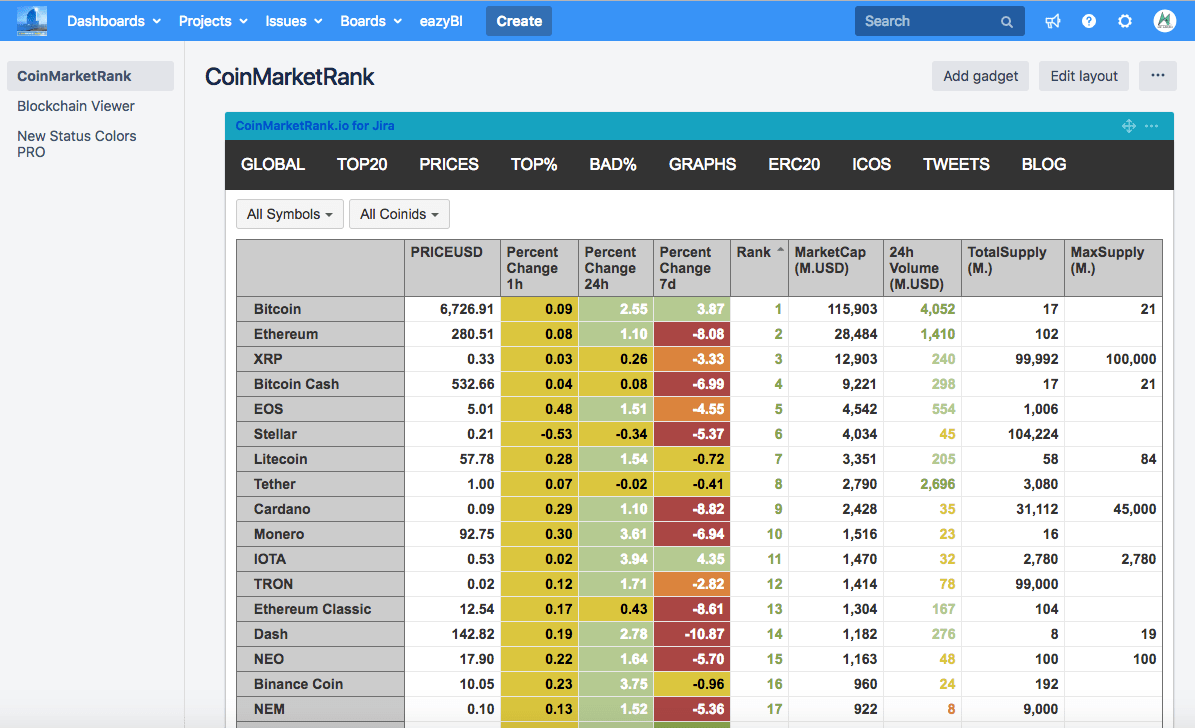
eazyBI for Crypto analysis & the project CoinMarketRank.io
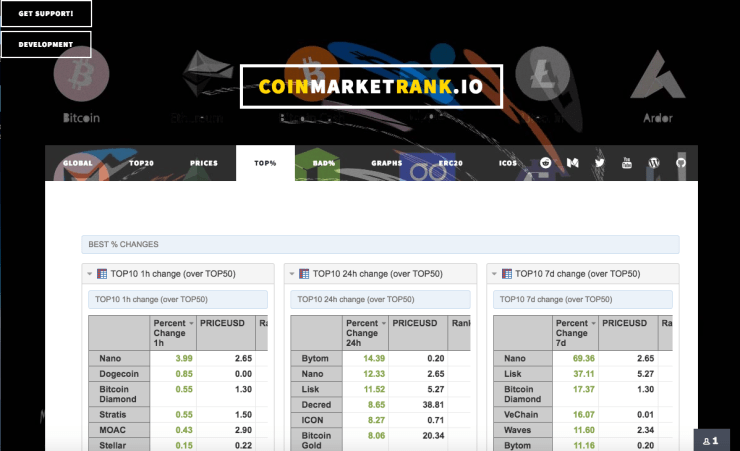
In this example, we want to explore the power eazyBI for cryptocurrencies markets analysis. CoinMarketRank.io is a Web-application and mobile-application ( and a Jira Server add-on) that uses eazyBI to show amazing and beautiful widgets/reports/graphs to control/visualize the current prices and evolution of the cryptocurrencies markets. We can explore the evolution of Bitcoin, Ethereum, Ripple, Litecoin, and others in an easy way. The source-code is OpenSource and available on GitHub.
Make your own CoinMarketRank apps!
(CoinMarketRank.io is using PhoneGap and Apache Cordova technology to publish the app versions for Android and iOS. Prerequisites: Jira and eazyBI and knowledge of HTML and a little of javascript)
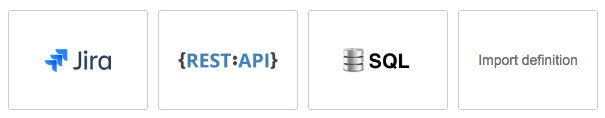
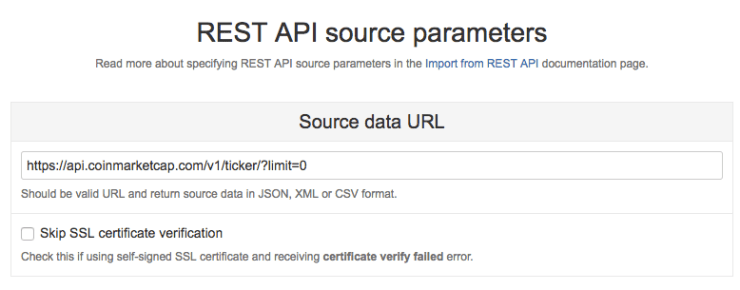
How to import Crypto data (How to connect to Crypto data sources)
Is very easy with eazyBI! Just create a new Cube and setup a new REST source data. In the example we use the CoinMarketCap.com REST API to import the markets data.
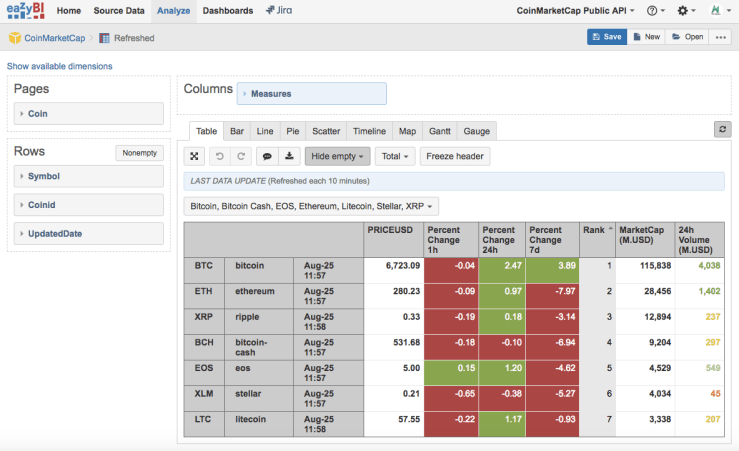
After this map the columns to new Dimensions, or to Measures Dimension.
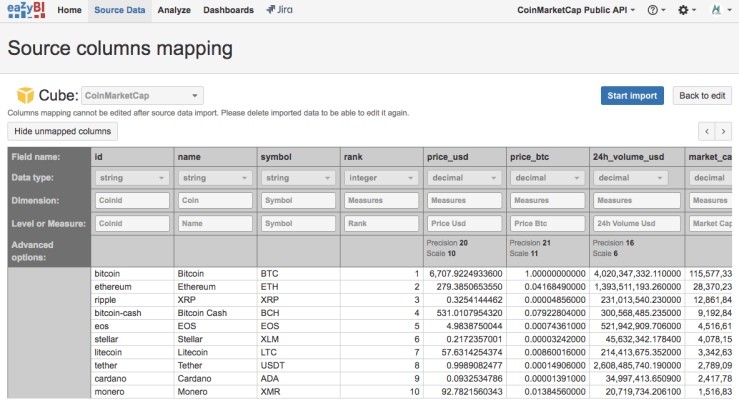
Import the data, and just create a new Report like an Excel Pivot Table!
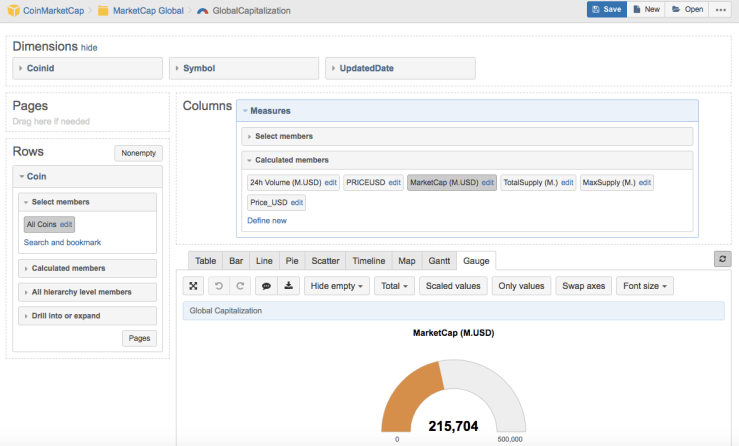
Creating a few Crypto reports.
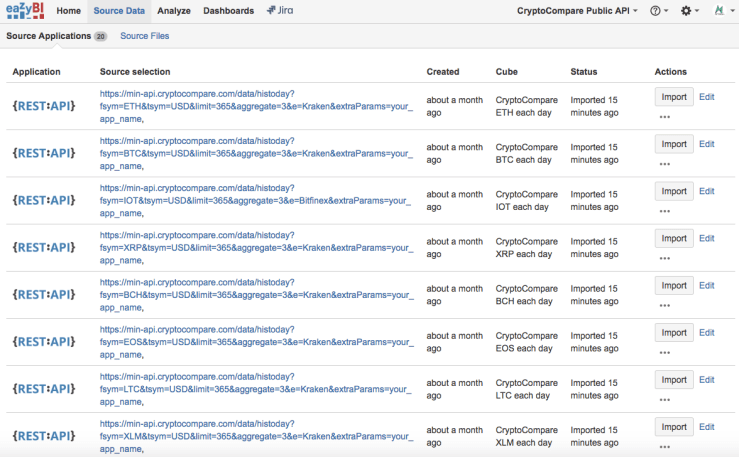
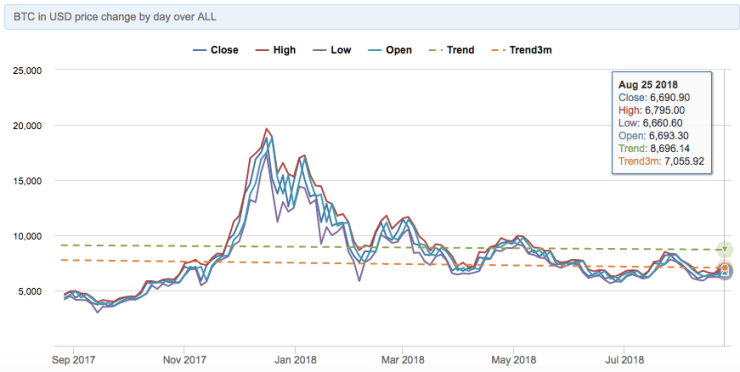
We can try to create a new cubes with a lot of different REST Endpoints, for example using CryptoCompare.com REST API to obtain the charts and evolution-graphs of Bitcoin, Ethereum and other cryptocurrencies.
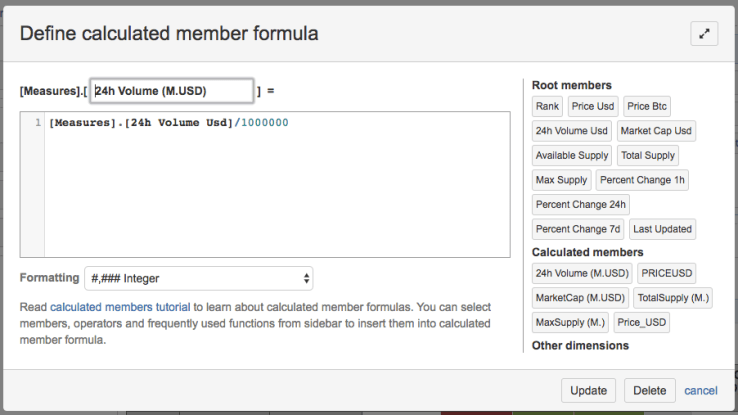
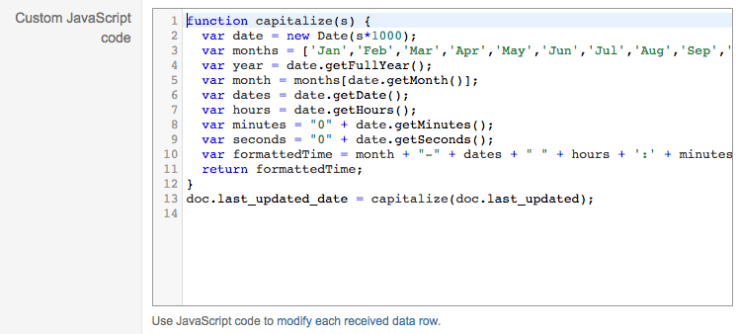
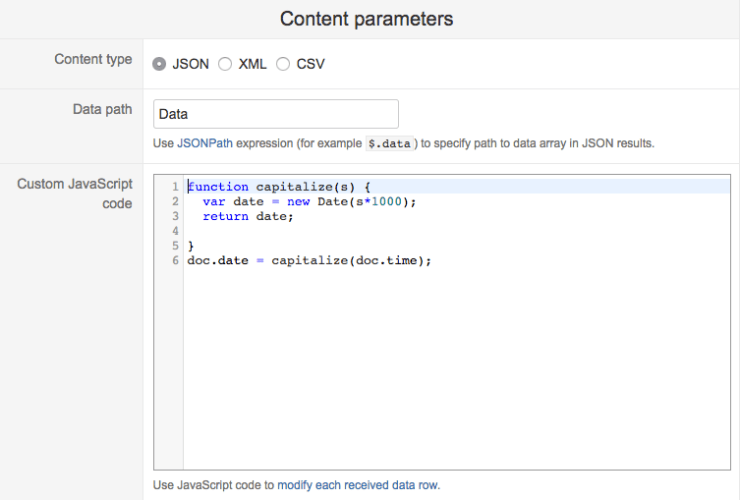
With eazyBI we can accurate the data to obtain using Javascript code.
And, in each cube, we can add new graphs and reports.
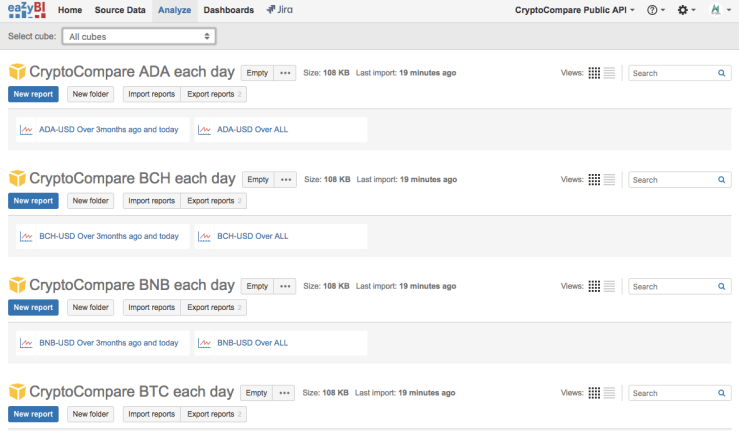
We can also calculate measures with eazyBI, very useful for to calculate Trend lines: in a year, in the last 3 months, etc. and other complex formulas like SMA, EMA…
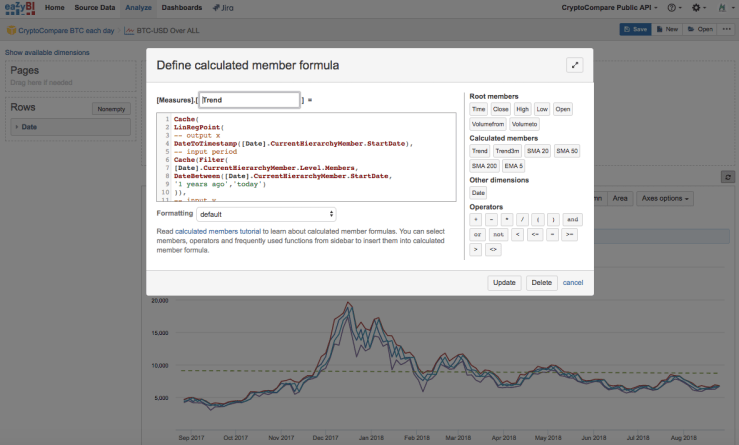
Code used to calculate the Trend line:
Cache(
LinRegPoint(
-- output x
DateToTimestamp([Date].CurrentHierarchyMember.StartDate),
-- input period
Cache(Filter(
[Date].CurrentHierarchyMember.Level.Members,
DateBetween([Date].CurrentHierarchyMember.StartDate,
'1 years ago','today')
)),
-- input y
Cache([Measures].[High]),
-- input x
DateToTimestamp([Date].CurrentHierarchyMember.StartDate)
)
)
About the author
Raul Pelaez Mendoza is an Atlassian Jira Expert based in Barcelona (Spain) with more than 7 years of experience in Atlassian Ecosystem and more than 20 years of experience in the implementation of Java-based Systems (starting in the IBM Lotus Notes/Domino era!) for Project Management Offices (PMO’s) in diverse public and private international corporations. Specialist in business process outsourcing (BPO) and operations management. Currently working at Ankonan doing consulting services, training courses and administration of the Atlassian platforms of diverse companies. Usual Jira and Blockchain teacher/speaker in the trainings based in Knowtech offices.
He was the CTO of Linkcare Health Services and since 2016 is CTO/founder of Ankonan, MrAddon, Letradoo and CoinMarketRank. Blogger of www.mraddon.blog posting tricks and tips of Jira and Confluence and other topics like posts of Ethereum Smart-Contracts and other cryptocurrencies. Usual speaker in the Atlassian User Group Barcelona-based events. Creator of diverse plugins for Jira and Confluence (Server & Cloud) and Atlassian Marketplace Vendor. Google Play Vendor, Apple Store Vendor. Etherum & Blockchain fanatic, DJ and artist with experience in Digital Music Distribution.
Technical Engineer in Computer Systems by UPC University (Barcelona). Technology Teacher Certificate by the UPC. SNOMED-CT/HL7/CDA Certified. Specialist in Intellectual Property Expertise by the ACPJT. IT-Forensics Expert by the ACPJT. Certified Blockchain Solution Architect (CBSA) by the Blockchain Training Alliance. eazyBI partner and Training partner.


