In this example, we want to explain how we can create a Heatmap (Worldmap) using eazyBI (in this case for Jira).
As prerequisite we need a CSV with at least 3 fields: one for the ID of the row and other two fields for the longitude and geographical latitude.
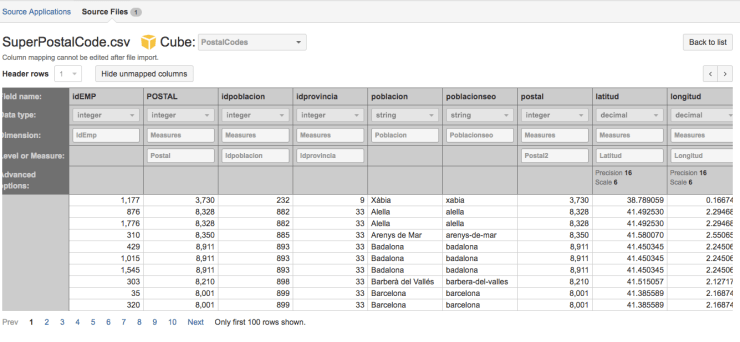
We need a special dimension for the ID column, and use the Measures dimension for the latitude and longitude.
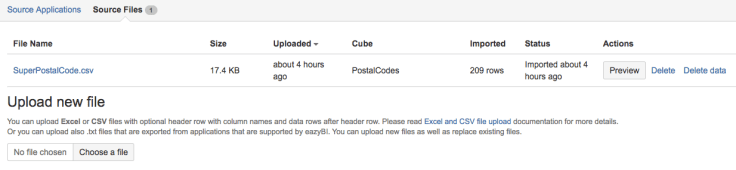
Once imported in the eazyBI account….
We can start creating the Report, in this case a Map report.

It’s mandatory the two first columns must be the latitude and longitude/length, now we can show the Map points.
It’s beautiful!!! I love the ZOOM feature!

It’s usual to unknown the geographical coordinates, so for this reason we usually cross databases to obtain this value, for example we can obtain a database of the Spain villages here.
Once downloaded, import the tables in some MySQL server in your laptop. Just transform your source file CSV in “INSERT” sentences using Excel or Google Sheets.
Import the SQL “INSERT” sentences in your MySQL and just JOIN the tables. Export the results in another CSV and you will be ready to import to EazyBI
Another way to do Heatmaps with eazyBI is using the ISO code of the Region/Country. I will explain in a future post… 😉
That’s all!
By MrAddon


