X days ago, we post How to calculate “Lead Time” or “Real Average Resolution Days” with eazyBI and JIRA
Now it’s turn to do the same, or similar, with Javascript fields in eazyBI and JIRA.
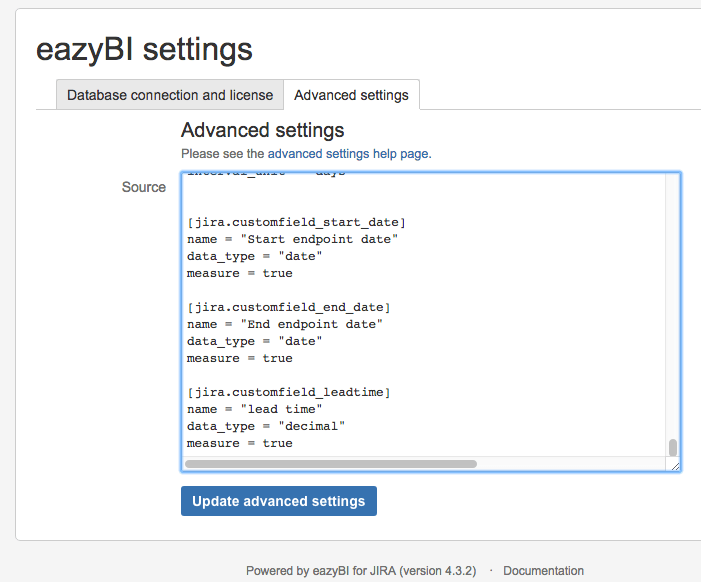
First of all we need to configure (or your JIRA Admin) the eazyBI settings to add three new Javascript customfields.
We must put something like this:
[jira.customfield_start_date]
name = "Start endpoint date"
data_type = "date"
measure = true

[jira.customfield_end_date]
name = "End endpoint date"
data_type = "date"
measure = true

[jira.customfield_leadtime]
name = "lead time"
data_type = "decimal"
measure = true
Once updated the settings of eazyBI...
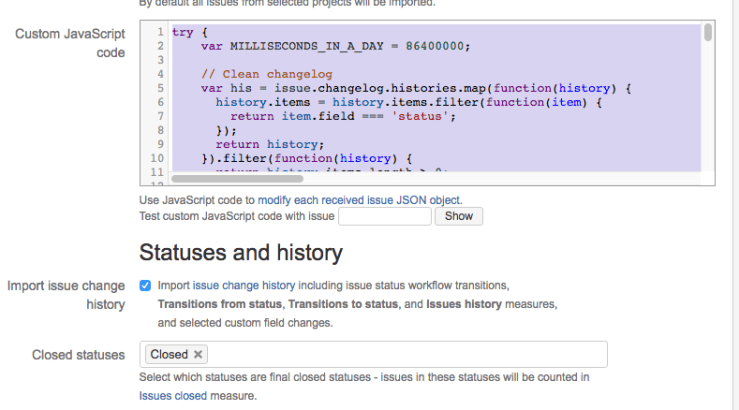
Then in the Cube import options we can set a javascript like this to make the calculation of the time between two statuses in a X time (for example in the first date of the end status). We can obtain the values from the Changelog of the issue. And, as extra, we can discount the weekends to the final measure to be more accurate.
try {
    var MILLISECONDS_IN_A_DAY = 86400000;

    // Clean changelog
    var his = issue.changelog.histories.map(function(history) {
      history.items = history.items.filter(function(item) {
        return item.field === 'status';
      });
      return history;
    }).filter(function(history) {
      return history.items.length > 0;
    }).reverse();

    var status_changed_to = function(statuses) {
      var filtered_change_log = his.filter(function(history) {
        return history.items.some(function(item) {
            return item.field === 'status' && item.fromString !== item.toString && statuses.indexOf(item.toString) > -1;
        });
      });
      return filtered_change_log.length == 0 ? null : new Date(Date.parse(filtered_change_log[0].created));
    };

    issue.fields.customfield_start_date = status_changed_to(['In Progress']);
    issue.fields.customfield_end_date = status_changed_to(['Resolved','Closed']);

    if (issue.fields.customfield_end_date && issue.fields.customfield_start_date ) {
      issue.fields.customfield_leadtime = ((issue.fields.customfield_end_date.getTime() - issue.fields.customfield_start_date.getTime()) / MILLISECONDS_IN_A_DAY) - getWeekendsDays(new Date(issue.fields.customfield_start_date),new Date(issue.fields.customfield_end_date))
    } else  {
      //issue.fields.customfield_start_date = issue.fields.customfield_end_date;
      issue.fields.customfield_leadtime = 0;
    }

} catch(err) {
  throw issue.key + " (" + err + ")";
}

 function getWeekendsDays(startDate, endDate){
    var result = 0;

    var currentDate = startDate;
    while (currentDate <= endDate)  {

        var weekDay = currentDate.getDay();
        if(weekDay == 0 || weekDay == 6)
            result++;

         currentDate.setDate(currentDate.getDate()+1);
    }

    return result;
 }
Once inserted the code, we can test with a known issue and see the values obtained in the three new javascript customfield.
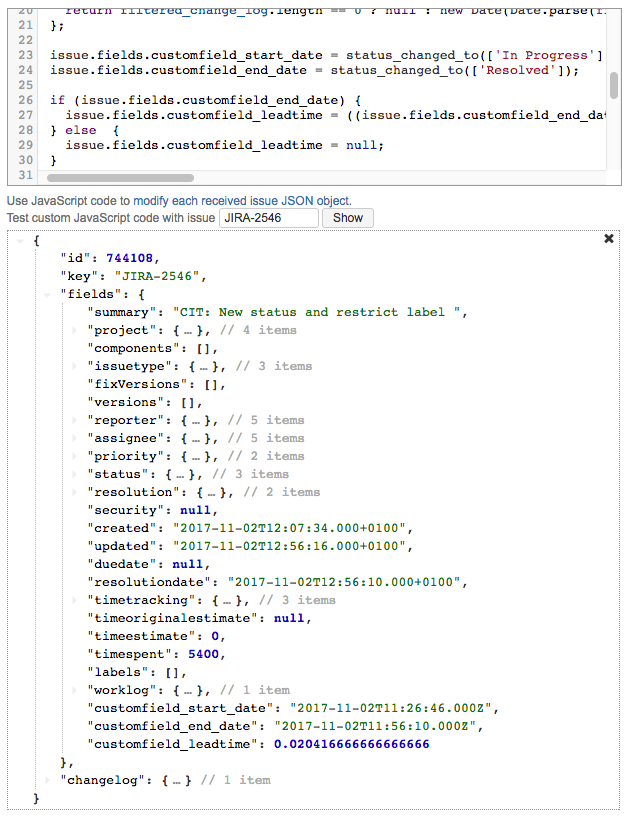
Then don’t forgive to check the three new customfields to obtain the data and see the results in the reports.
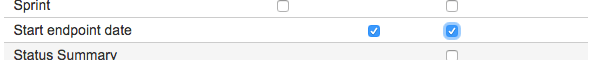

Now, we can Save and Start the import!
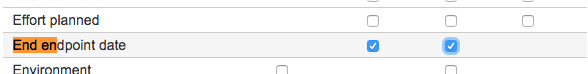
Creating the report, you will see new properties in Measures Dimension, like “Issue End endpoint date” and “Issue Start endpoint date”
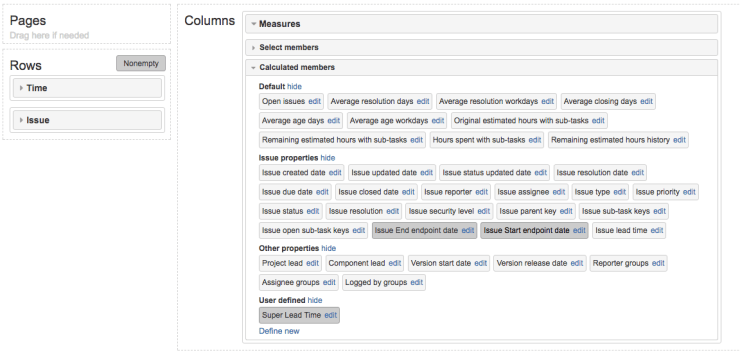
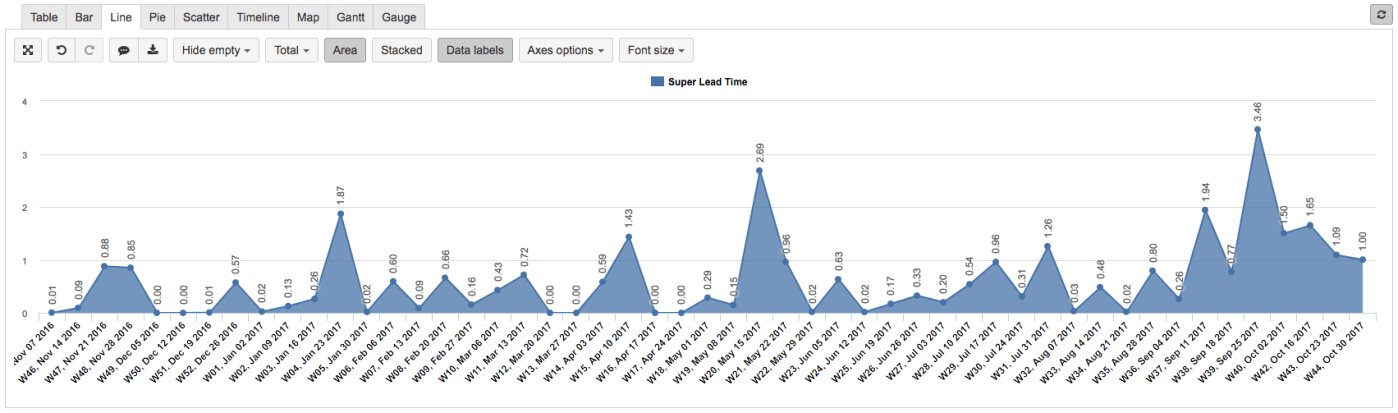
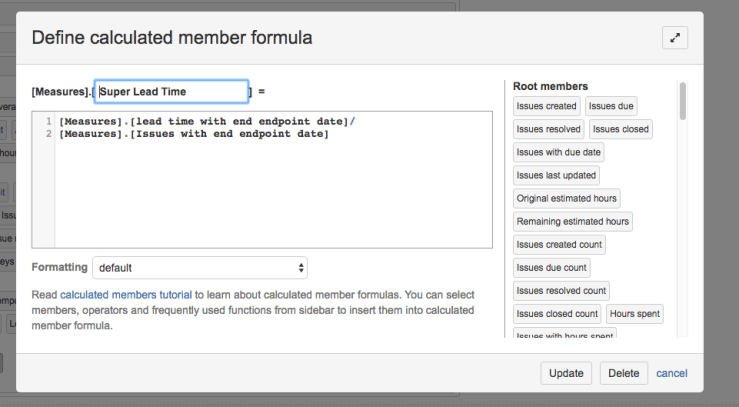
And we can create also a Calculated Measure to get the average real lead time.
[Measures].[Super Lead Time] =[Measures].[lead time with end endpoint date]/[Measures].[Issues with end endpoint date]
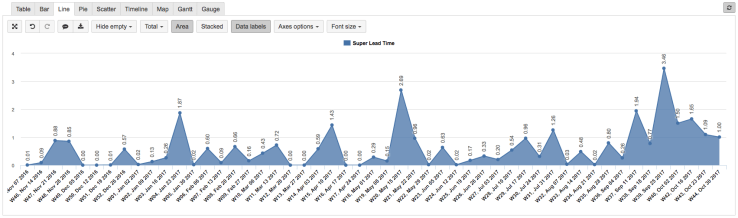
And now, we can see the results!
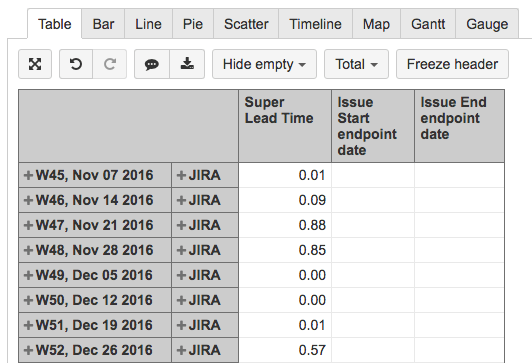
Once the project is expanded… we can see the lead time with the dates.

Thanks for reading this and have a nice Lead time report day!
If you need more info about eazyBI javascript fields, see this link.


