
(IMPORTANT UPDATE OF THIS POST: See How to calculate “Lead Time” or “Real Average Resolution Days” with eazyBI and JIRA (Part II))
The default calculated measure of eazyBI “Average Resolution Days” counts until the last Resolution filled ( not until the first value of the Resolution field), then if you set a new Resolution from “Resolved” to “Close” statuses, the value will be measured until “Close”. eazyBI counts the resolution time till the last resolution. This is a problem to measure some concepts like the “Lead Time”, or efficiency/performance in some projects.
How we can measure a perfect “Lead Time”?
The best way, I think, is the sum of the time spent in all statuses that counts for the measure that we want.
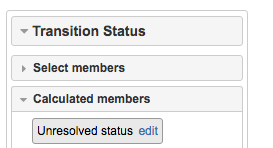
Then we can set a calculated measure in the dimension “Transition Status”.
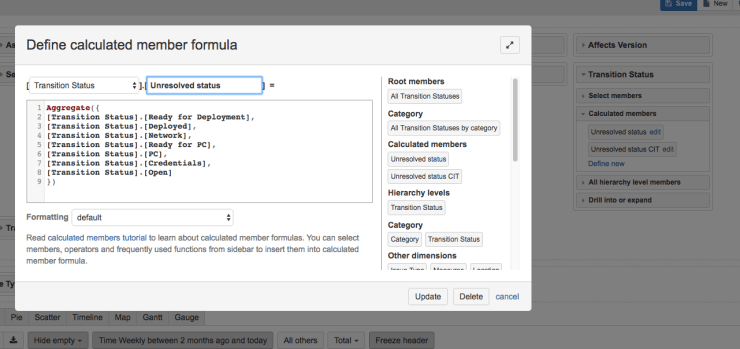
Create a calculated member in the Transition status dimension with the formula like this (“Unresolved statuses“):
Aggregate({
  [Transition status].[Open],
  [Transition status].[Preparation],
  [Transition status].[Backlog],
  [Transition status].[In Progress]
})
See this example screenshots:
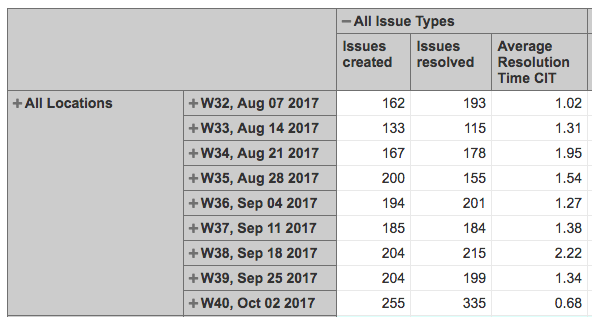
Then, you can create a new Calculated Measure in the “Measures” dimension showing the average time issues spent in those statuses:
CASE WHEN [Measures].[Issues resolved] > 0 THEN
([Measures].[Workdays in transition status], [Transition status].[Unresolved status])
 / [Measures].[Issues resolved]
END
This should calculate the average time till the first resolution.
See this example screenshots:


Then we can activate the Calculated Measure and see the expected result
Many thanks for the support eazyBI team!
(IMPORTANT UPDATE OF THIS POST: See How to calculate “Lead Time” or “Real Average Resolution Days” with eazyBI and JIRA (Part II))


Hi,
Do I have to aggregate all the unresolved status in ‘Transition status’ dimension? My calculated member does not show anything…
Thank you!
BR, Wenhao
LikeLike