Original POST from Lewe.com and adapted for Confluence 5.10 by MrAddon and Jose Manuel Beas (super Agile coach)
Instructions:
First go to the Conflunce Configuration/Administration and create two User Macros

In the first User Macro: chartjs, put this code (with “No Macro body“):
## Macro title: ChartJS: Script
## Macro body processing: No macro body
##
## Developed by: George Lewe
## Date created: 2015-03-03
##
## This macro needs to be included once in every page that makes use of a ChartJS chart macro.
##
## @noparams

<script type="text/javascript">
//<![CDATA[
window.onload = function()
{
 var canvs = document.getElementsByTagName("canvas");
 for(var i = 0; i < canvs.length; i++)
 {
 var canvid = canvs[i].getAttribute('id');
 var data = 'data' + canvid;
 var options = 'options' + canvid;
 var ctx = document.getElementById(canvid).getContext("2d");

switch(canvs[i].getAttribute('data-charttype'))
 {
 case "bar":
 window.canvid = new Chart(ctx).Bar(window[data], window[options]);
 break;

 case "line":
 window.canvid = new Chart(ctx).Line(window[data], window[options]);
 break;

case "radar":
 window.canvid = new Chart(ctx).Radar(window[data], window[options]);
 break;

case "pie":
 window.canvid = new Chart(ctx).Pie(window[data], window[options]);
 break;

case "doughnut":
 window.canvid = new Chart(ctx).Doughnut(window[data], window[options]);
 break;

default:
 window.canvid = new Chart(ctx).Bar(window[data], window[options]);
 break;
 }
 }
}
//]]>
</script>

<script type="text/javascript">
//<![CDATA[
 (function() {
 "use strict";
 var t = this,
 i = t.Chart,
 e = function(t) {
 this.canvas = t.canvas, this.ctx = t;
 this.width = t.canvas.width, this.height = t.canvas.height;
 return this.aspectRatio = this.width / this.height, s.retinaScale(this), this
 };
 e.defaults = {
 global: {
 animation: !0,
 animationSteps: 60,
 animationEasing: "easeOutQuart",
 showScale: !0,
 scaleOverride: !1,
 scaleSteps: null,
 scaleStepWidth: null,
 scaleStartValue: null,
 scaleLineColor: "rgba(0,0,0,.1)",
 scaleLineWidth: 1,
 scaleShowLabels: !0,
 scaleLabel: "<%=value%>",
 scaleIntegersOnly: !0,
 scaleBeginAtZero: !1,
 scaleFontFamily: "'Helvetica Neue', 'Helvetica', 'Arial', sans-serif",
 scaleFontSize: 12,
 scaleFontStyle: "normal",
 scaleFontColor: "#666",
 responsive: !1,
 maintainAspectRatio: !0,
 showTooltips: !0,
 customTooltips: !1,
 tooltipEvents: ["mousemove", "touchstart", "touchmove", "mouseout"],
 tooltipFillColor: "rgba(0,0,0,0.8)",
 tooltipFontFamily: "'Helvetica Neue', 'Helvetica', 'Arial', sans-serif",
 tooltipFontSize: 14,
 tooltipFontStyle: "normal",
 tooltipFontColor: "#fff",
 tooltipTitleFontFamily: "'Helvetica Neue', 'Helvetica', 'Arial', sans-serif",
 tooltipTitleFontSize: 14,
 tooltipTitleFontStyle: "bold",
 tooltipTitleFontColor: "#fff",
 tooltipYPadding: 6,
 tooltipXPadding: 6,
 tooltipCaretSize: 8,
 tooltipCornerRadius: 6,
 tooltipXOffset: 10,
 tooltipTemplate: "<%if (label){%><%=label%>: <%}%><%= value %>",
 multiTooltipTemplate: "<%= value %>",
 multiTooltipKeyBackground: "#fff",
 onAnimationProgress: function() {},
 onAnimationComplete: function() {}
 }
 }, e.types = {};
 var s = e.helpers = {},
 n = s.each = function(t, i, e) {
 var s = Array.prototype.slice.call(arguments, 3);
 if (t)
 if (t.length === +t.length) {
 var n;
 for (n = 0; n < t.length; n++) i.apply(e, [t[n], n].concat(s))
 } else
 for (var o in t) i.apply(e, [t[o], o].concat(s))
 },
 o = s.clone = function(t) {
 var i = {};
 return n(t, function(e, s) {
 t.hasOwnProperty(s) && (i[s] = e)
 }), i
 },
 a = s.extend = function(t) {
 return n(Array.prototype.slice.call(arguments, 1), function(i) {
 n(i, function(e, s) {
 i.hasOwnProperty(s) && (t[s] = e)
 })
 }), t
 },
 h = s.merge = function() {
 var t = Array.prototype.slice.call(arguments, 0);
 return t.unshift({}), a.apply(null, t)
 },
 l = s.indexOf = function(t, i) {
 if (Array.prototype.indexOf) return t.indexOf(i);
 for (var e = 0; e < t.length; e++)
 if (t[e] === i) return e;
 return -1
 },
 r = (s.where = function(t, i) {
 var e = [];
 return s.each(t, function(t) {
 i(t) && e.push(t)
 }), e
 }, s.findNextWhere = function(t, i, e) {
 e || (e = -1);
 for (var s = e + 1; s < t.length; s++) {
 var n = t[s];
 if (i(n)) return n
 }
 }, s.findPreviousWhere = function(t, i, e) {
 e || (e = t.length);
 for (var s = e - 1; s >= 0; s--) {
 var n = t[s];
 if (i(n)) return n
 }
 }, s.inherits = function(t) {
 var i = this,
 e = t && t.hasOwnProperty("constructor") ? t.constructor : function() {
 return i.apply(this, arguments)
 },
 s = function() {
 this.constructor = e
 };
 return s.prototype = i.prototype, e.prototype = new s, e.extend = r, t && a(e.prototype, t), e.__super__ = i.prototype, e
 }),
 c = s.noop = function() {},
 u = s.uid = function() {
 var t = 0;
 return function() {
 return "chart-" + t++
 }
 }(),
 d = s.warn = function(t) {
 window.console && "function" == typeof window.console.warn && console.warn(t)
 },
 p = s.amd = "function" == typeof define && define.amd,
 f = s.isNumber = function(t) {
 return !isNaN(parseFloat(t)) && isFinite(t)
 },
 g = s.max = function(t) {
 return Math.max.apply(Math, t)
 },
 m = s.min = function(t) {
 return Math.min.apply(Math, t)
 },
 v = (s.cap = function(t, i, e) {
 if (f(i)) {
 if (t > i) return i
 } else if (f(e) && e > t) return e;
 return t
 }, s.getDecimalPlaces = function(t) {
 return t % 1 !== 0 && f(t) ? t.toString().split(".")[1].length : 0
 }),
 S = s.radians = function(t) {
 return t * (Math.PI / 180)
 },
 x = (s.getAngleFromPoint = function(t, i) {
 var e = i.x - t.x,
 s = i.y - t.y,
 n = Math.sqrt(e * e + s * s),
 o = 2 * Math.PI + Math.atan2(s, e);
 return 0 > e && 0 > s && (o += 2 * Math.PI), {
 angle: o,
 distance: n
 }
 }, s.aliasPixel = function(t) {
 return t % 2 === 0 ? 0 : .5
 }),
 y = (s.splineCurve = function(t, i, e, s) {
 var n = Math.sqrt(Math.pow(i.x - t.x, 2) + Math.pow(i.y - t.y, 2)),
 o = Math.sqrt(Math.pow(e.x - i.x, 2) + Math.pow(e.y - i.y, 2)),
 a = s * n / (n + o),
 h = s * o / (n + o);
 return {
 inner: {
 x: i.x - a * (e.x - t.x),
 y: i.y - a * (e.y - t.y)
 },
 outer: {
 x: i.x + h * (e.x - t.x),
 y: i.y + h * (e.y - t.y)
 }
 }
 }, s.calculateOrderOfMagnitude = function(t) {
 return Math.floor(Math.log(t) / Math.LN10)
 }),
 C = (s.calculateScaleRange = function(t, i, e, s, n) {
 var o = 2,
 a = Math.floor(i / (1.5 * e)),
 h = o >= a,
 l = g(t),
 r = m(t);
 l === r && (l += .5, r >= .5 && !s ? r -= .5 : l += .5);
 for (var c = Math.abs(l - r), u = y(c), d = Math.ceil(l / (1 * Math.pow(10, u))) * Math.pow(10, u), p = s ? 0 : Math.floor(r / (1 * Math.pow(10, u))) * Math.pow(10, u), f = d - p, v = Math.pow(10, u), S = Math.round(f / v);
 (S > a || a > 2 * S) && !h;)
 if (S > a) v *= 2, S = Math.round(f / v), S % 1 !== 0 && (h = !0);
 else if (n && u >= 0) {
 if (v / 2 % 1 !== 0) break;
 v /= 2, S = Math.round(f / v)
 } else v /= 2, S = Math.round(f / v);
 return h && (S = o, v = f / S), {
 steps: S,
 stepValue: v,
 min: p,
 max: p + S * v
 }
 }, s.template = function(t, i) {
 function e(t, i) {
 var e = /\W/.test(t) ? new Function("obj", "var p=[],print=function(){p.push.apply(p,arguments);};with(obj){p.push('" + t.replace(/[\r\t\n]/g, " ").split("<%").join(" ").replace(/((^|%>)[^\t]*)'/g, "$1\r").replace(/\t=(.*?)%>/g, "',$1,'").split(" ").join("');").split("%>").join("p.push('").split("\r").join("\\'") + "');}return p.join('');") : s[t] = s[t];
 return i ? e(i) : e
 }
 if (t instanceof Function) return t(i);
 var s = {};
 return e(t, i)
 }),
 w = (s.generateLabels = function(t, i, e, s) {
 var o = new Array(i);
 return labelTemplateString && n(o, function(i, n) {
 o[n] = C(t, {
 value: e + s * (n + 1)
 })
 }), o
 }, s.easingEffects = {
 linear: function(t) {
 return t
 },
 easeInQuad: function(t) {
 return t * t
 },
 easeOutQuad: function(t) {
 return -1 * t * (t - 2)
 },
 easeInOutQuad: function(t) {
 return (t /= .5) < 1 ? .5 * t * t : -0.5 * (--t * (t - 2) - 1)
 },
 easeInCubic: function(t) {
 return t * t * t
 },
 easeOutCubic: function(t) {
 return 1 * ((t = t / 1 - 1) * t * t + 1)
 },
 easeInOutCubic: function(t) {
 return (t /= .5) < 1 ? .5 * t * t * t : .5 * ((t -= 2) * t * t + 2)
 },
 easeInQuart: function(t) {
 return t * t * t * t
 },
 easeOutQuart: function(t) {
 return -1 * ((t = t / 1 - 1) * t * t * t - 1)
 },
 easeInOutQuart: function(t) {
 return (t /= .5) < 1 ? .5 * t * t * t * t : -0.5 * ((t -= 2) * t * t * t - 2)
 },
 easeInQuint: function(t) {
 return 1 * (t /= 1) * t * t * t * t
 },
 easeOutQuint: function(t) {
 return 1 * ((t = t / 1 - 1) * t * t * t * t + 1)
 },
 easeInOutQuint: function(t) {
 return (t /= .5) < 1 ? .5 * t * t * t * t * t : .5 * ((t -= 2) * t * t * t * t + 2)
 },
 easeInSine: function(t) {
 return -1 * Math.cos(t / 1 * (Math.PI / 2)) + 1
 },
 easeOutSine: function(t) {
 return 1 * Math.sin(t / 1 * (Math.PI / 2))
 },
 easeInOutSine: function(t) {
 return -0.5 * (Math.cos(Math.PI * t / 1) - 1)
 },
 easeInExpo: function(t) {
 return 0 === t ? 1 : 1 * Math.pow(2, 10 * (t / 1 - 1))
 },
 easeOutExpo: function(t) {
 return 1 === t ? 1 : 1 * (-Math.pow(2, -10 * t / 1) + 1)
 },
 easeInOutExpo: function(t) {
 return 0 === t ? 0 : 1 === t ? 1 : (t /= .5) < 1 ? .5 * Math.pow(2, 10 * (t - 1)) : .5 * (-Math.pow(2, -10 * --t) + 2)
 },
 easeInCirc: function(t) {
 return t >= 1 ? t : -1 * (Math.sqrt(1 - (t /= 1) * t) - 1)
 },
 easeOutCirc: function(t) {
 return 1 * Math.sqrt(1 - (t = t / 1 - 1) * t)
 },
 easeInOutCirc: function(t) {
 return (t /= .5) < 1 ? -0.5 * (Math.sqrt(1 - t * t) - 1) : .5 * (Math.sqrt(1 - (t -= 2) * t) + 1)
 },
 easeInElastic: function(t) {
 var i = 1.70158,
 e = 0,
 s = 1;
 return 0 === t ? 0 : 1 == (t /= 1) ? 1 : (e || (e = .3), s < Math.abs(1) ? (s = 1, i = e / 4) : i = e / (2 * Math.PI) * Math.asin(1 / s), -(s * Math.pow(2, 10 * (t -= 1)) * Math.sin(2 * (1 * t - i) * Math.PI / e)))
 },
 easeOutElastic: function(t) {
 var i = 1.70158,
 e = 0,
 s = 1;
 return 0 === t ? 0 : 1 == (t /= 1) ? 1 : (e || (e = .3), s < Math.abs(1) ? (s = 1, i = e / 4) : i = e / (2 * Math.PI) * Math.asin(1 / s), s * Math.pow(2, -10 * t) * Math.sin(2 * (1 * t - i) * Math.PI / e) + 1)
 },
 easeInOutElastic: function(t) {
 var i = 1.70158,
 e = 0,
 s = 1;
 return 0 === t ? 0 : 2 == (t /= .5) ? 1 : (e || (e = .3 * 1.5), s < Math.abs(1) ? (s = 1, i = e / 4) : i = e / (2 * Math.PI) * Math.asin(1 / s), 1 > t ? -.5 * s * Math.pow(2, 10 * (t -= 1)) * Math.sin(2 * (1 * t - i) * Math.PI / e) : s * Math.pow(2, -10 * (t -= 1)) * Math.sin(2 * (1 * t - i) * Math.PI / e) * .5 + 1)
 },
 easeInBack: function(t) {
 var i = 1.70158;
 return 1 * (t /= 1) * t * ((i + 1) * t - i)
 },
 easeOutBack: function(t) {
 var i = 1.70158;
 return 1 * ((t = t / 1 - 1) * t * ((i + 1) * t + i) + 1)
 },
 easeInOutBack: function(t) {
 var i = 1.70158;
 return (t /= .5) < 1 ? .5 * t * t * (((i *= 1.525) + 1) * t - i) : .5 * ((t -= 2) * t * (((i *= 1.525) + 1) * t + i) + 2)
 },
 easeInBounce: function(t) {
 return 1 - w.easeOutBounce(1 - t)
 },
 easeOutBounce: function(t) {
 return (t /= 1) < 1 / 2.75 ? 7.5625 * t * t : 2 / 2.75 > t ? 1 * (7.5625 * (t -= 1.5 / 2.75) * t + .75) : 2.5 / 2.75 > t ? 1 * (7.5625 * (t -= 2.25 / 2.75) * t + .9375) : 1 * (7.5625 * (t -= 2.625 / 2.75) * t + .984375)
 },
 easeInOutBounce: function(t) {
 return .5 > t ? .5 * w.easeInBounce(2 * t) : .5 * w.easeOutBounce(2 * t - 1) + .5
 }
 }),
 b = s.requestAnimFrame = function() {
 return window.requestAnimationFrame || window.webkitRequestAnimationFrame || window.mozRequestAnimationFrame || window.oRequestAnimationFrame || window.msRequestAnimationFrame || function(t) {
 return window.setTimeout(t, 1e3 / 60)
 }
 }(),
 P = (s.cancelAnimFrame = function() {
 return window.cancelAnimationFrame || window.webkitCancelAnimationFrame || window.mozCancelAnimationFrame || window.oCancelAnimationFrame || window.msCancelAnimationFrame || function(t) {
 return window.clearTimeout(t, 1e3 / 60)
 }
 }(), s.animationLoop = function(t, i, e, s, n, o) {
 var a = 0,
 h = w[e] || w.linear,
 l = function() {
 a++;
 var e = a / i,
 r = h(e);
 t.call(o, r, e, a), s.call(o, r, e), i > a ? o.animationFrame = b(l) : n.apply(o)
 };
 b(l)
 }, s.getRelativePosition = function(t) {
 var i, e, s = t.originalEvent || t,
 n = t.currentTarget || t.srcElement,
 o = n.getBoundingClientRect();
 return s.touches ? (i = s.touches[0].clientX - o.left, e = s.touches[0].clientY - o.top) : (i = s.clientX - o.left, e = s.clientY - o.top), {
 x: i,
 y: e
 }
 }, s.addEvent = function(t, i, e) {
 t.addEventListener ? t.addEventListener(i, e) : t.attachEvent ? t.attachEvent("on" + i, e) : t["on" + i] = e
 }),
 L = s.removeEvent = function(t, i, e) {
 t.removeEventListener ? t.removeEventListener(i, e, !1) : t.detachEvent ? t.detachEvent("on" + i, e) : t["on" + i] = c
 },
 k = (s.bindEvents = function(t, i, e) {
 t.events || (t.events = {}), n(i, function(i) {
 t.events[i] = function() {
 e.apply(t, arguments)
 }, P(t.chart.canvas, i, t.events[i])
 })
 }, s.unbindEvents = function(t, i) {
 n(i, function(i, e) {
 L(t.chart.canvas, e, i)
 })
 }),
 F = s.getMaximumWidth = function(t) {
 var i = t.parentNode;
 return i.clientWidth
 },
 R = s.getMaximumHeight = function(t) {
 var i = t.parentNode;
 return i.clientHeight
 },
 T = (s.getMaximumSize = s.getMaximumWidth, s.retinaScale = function(t) {
 var i = t.ctx,
 e = t.canvas.width,
 s = t.canvas.height;
 window.devicePixelRatio && (i.canvas.style.width = e + "px", i.canvas.style.height = s + "px", i.canvas.height = s * window.devicePixelRatio, i.canvas.width = e * window.devicePixelRatio, i.scale(window.devicePixelRatio, window.devicePixelRatio))
 }),
 A = s.clear = function(t) {
 t.ctx.clearRect(0, 0, t.width, t.height)
 },
 M = s.fontString = function(t, i, e) {
 return i + " " + t + "px " + e
 },
 W = s.longestText = function(t, i, e) {
 t.font = i;
 var s = 0;
 return n(e, function(i) {
 var e = t.measureText(i).width;
 s = e > s ? e : s
 }), s
 },
 z = s.drawRoundedRectangle = function(t, i, e, s, n, o) {
 t.beginPath(), t.moveTo(i + o, e), t.lineTo(i + s - o, e), t.quadraticCurveTo(i + s, e, i + s, e + o), t.lineTo(i + s, e + n - o), t.quadraticCurveTo(i + s, e + n, i + s - o, e + n), t.lineTo(i + o, e + n), t.quadraticCurveTo(i, e + n, i, e + n - o), t.lineTo(i, e + o), t.quadraticCurveTo(i, e, i + o, e), t.closePath()
 };
 e.instances = {}, e.Type = function(t, i, s) {
 this.options = i, this.chart = s, this.id = u(), e.instances[this.id] = this, i.responsive && this.resize(), this.initialize.call(this, t)
 }, a(e.Type.prototype, {
 initialize: function() {
 return this
 },
 clear: function() {
 return A(this.chart), this
 },
 stop: function() {
 return s.cancelAnimFrame.call(t, this.animationFrame), this
 },
 resize: function(t) {
 this.stop();
 var i = this.chart.canvas,
 e = F(this.chart.canvas),
 s = this.options.maintainAspectRatio ? e / this.chart.aspectRatio : R(this.chart.canvas);
 return i.width = this.chart.width = e, i.height = this.chart.height = s, T(this.chart), "function" == typeof t && t.apply(this, Array.prototype.slice.call(arguments, 1)), this
 },
 reflow: c,
 render: function(t) {
 return t && this.reflow(), this.options.animation && !t ? s.animationLoop(this.draw, this.options.animationSteps, this.options.animationEasing, this.options.onAnimationProgress, this.options.onAnimationComplete, this) : (this.draw(), this.options.onAnimationComplete.call(this)), this
 },
 generateLegend: function() {
 return C(this.options.legendTemplate, this)
 },
 destroy: function() {
 this.clear(), k(this, this.events);
 var t = this.chart.canvas;
 t.width = this.chart.width, t.height = this.chart.height, t.style.removeProperty ? (t.style.removeProperty("width"), t.style.removeProperty("height")) : (t.style.removeAttribute("width"), t.style.removeAttribute("height")), delete e.instances[this.id]
 },
 showTooltip: function(t, i) {
 "undefined" == typeof this.activeElements && (this.activeElements = []);
 var o = function(t) {
 var i = !1;
 return t.length !== this.activeElements.length ? i = !0 : (n(t, function(t, e) {
 t !== this.activeElements[e] && (i = !0)
 }, this), i)
 }.call(this, t);
 if (o || i) {
 if (this.activeElements = t, this.draw(), this.options.customTooltips && this.options.customTooltips(!1), t.length > 0)
 if (this.datasets && this.datasets.length > 1) {
 for (var a, h, r = this.datasets.length - 1; r >= 0 && (a = this.datasets[r].points || this.datasets[r].bars || this.datasets[r].segments, h = l(a, t[0]), -1 === h); r--);
 var c = [],
 u = [],
 d = function() {
 var t, i, e, n, o, a = [],
 l = [],
 r = [];
 return s.each(this.datasets, function(i) {
 t = i.points || i.bars || i.segments, t[h] && t[h].hasValue() && a.push(t[h])
 }), s.each(a, function(t) {
 l.push(t.x), r.push(t.y), c.push(s.template(this.options.multiTooltipTemplate, t)), u.push({
 fill: t._saved.fillColor || t.fillColor,
 stroke: t._saved.strokeColor || t.strokeColor
 })
 }, this), o = m(r), e = g(r), n = m(l), i = g(l), {
 x: n > this.chart.width / 2 ? n : i,
 y: (o + e) / 2
 }
 }.call(this, h);
 new e.MultiTooltip({
 x: d.x,
 y: d.y,
 xPadding: this.options.tooltipXPadding,
 yPadding: this.options.tooltipYPadding,
 xOffset: this.options.tooltipXOffset,
 fillColor: this.options.tooltipFillColor,
 textColor: this.options.tooltipFontColor,
 fontFamily: this.options.tooltipFontFamily,
 fontStyle: this.options.tooltipFontStyle,
 fontSize: this.options.tooltipFontSize,
 titleTextColor: this.options.tooltipTitleFontColor,
 titleFontFamily: this.options.tooltipTitleFontFamily,
 titleFontStyle: this.options.tooltipTitleFontStyle,
 titleFontSize: this.options.tooltipTitleFontSize,
 cornerRadius: this.options.tooltipCornerRadius,
 labels: c,
 legendColors: u,
 legendColorBackground: this.options.multiTooltipKeyBackground,
 title: t[0].label,
 chart: this.chart,
 ctx: this.chart.ctx,
 custom: this.options.customTooltips
 }).draw()
 } else n(t, function(t) {
 var i = t.tooltipPosition();
 new e.Tooltip({
 x: Math.round(i.x),
 y: Math.round(i.y),
 xPadding: this.options.tooltipXPadding,
 yPadding: this.options.tooltipYPadding,
 fillColor: this.options.tooltipFillColor,
 textColor: this.options.tooltipFontColor,
 fontFamily: this.options.tooltipFontFamily,
 fontStyle: this.options.tooltipFontStyle,
 fontSize: this.options.tooltipFontSize,
 caretHeight: this.options.tooltipCaretSize,
 cornerRadius: this.options.tooltipCornerRadius,
 text: C(this.options.tooltipTemplate, t),
 chart: this.chart,
 custom: this.options.customTooltips
 }).draw()
 }, this);
 return this
 }
 },
 toBase64Image: function() {
 return this.chart.canvas.toDataURL.apply(this.chart.canvas, arguments)
 }
 }), e.Type.extend = function(t) {
 var i = this,
 s = function() {
 return i.apply(this, arguments)
 };
 if (s.prototype = o(i.prototype), a(s.prototype, t), s.extend = e.Type.extend, t.name || i.prototype.name) {
 var n = t.name || i.prototype.name,
 l = e.defaults[i.prototype.name] ? o(e.defaults[i.prototype.name]) : {};
 e.defaults[n] = a(l, t.defaults), e.types[n] = s, e.prototype[n] = function(t, i) {
 var o = h(e.defaults.global, e.defaults[n], i || {});
 return new s(t, o, this)
 }
 } else d("Name not provided for this chart, so it hasn't been registered");
 return i
 }, e.Element = function(t) {
 a(this, t), this.initialize.apply(this, arguments), this.save()
 }, a(e.Element.prototype, {
 initialize: function() {},
 restore: function(t) {
 return t ? n(t, function(t) {
 this[t] = this._saved[t]
 }, this) : a(this, this._saved), this
 },
 save: function() {
 return this._saved = o(this), delete this._saved._saved, this
 },
 update: function(t) {
 return n(t, function(t, i) {
 this._saved[i] = this[i], this[i] = t
 }, this), this
 },
 transition: function(t, i) {
 return n(t, function(t, e) {
 this[e] = (t - this._saved[e]) * i + this._saved[e]
 }, this), this
 },
 tooltipPosition: function() {
 return {
 x: this.x,
 y: this.y
 }
 },
 hasValue: function() {
 return f(this.value)
 }
 }), e.Element.extend = r, e.Point = e.Element.extend({
 display: !0,
 inRange: function(t, i) {
 var e = this.hitDetectionRadius + this.radius;
 return Math.pow(t - this.x, 2) + Math.pow(i - this.y, 2) < Math.pow(e, 2)
 },
 draw: function() {
 if (this.display) {
 var t = this.ctx;
 t.beginPath(), t.arc(this.x, this.y, this.radius, 0, 2 * Math.PI), t.closePath(), t.strokeStyle = this.strokeColor, t.lineWidth = this.strokeWidth, t.fillStyle = this.fillColor, t.fill(), t.stroke()
 }
 }
 }), e.Arc = e.Element.extend({
 inRange: function(t, i) {
 var e = s.getAngleFromPoint(this, {
 x: t,
 y: i
 }),
 n = e.angle >= this.startAngle && e.angle <= this.endAngle,
 o = e.distance >= this.innerRadius && e.distance <= this.outerRadius;
 return n && o
 },
 tooltipPosition: function() {
 var t = this.startAngle + (this.endAngle - this.startAngle) / 2,
 i = (this.outerRadius - this.innerRadius) / 2 + this.innerRadius;
 return {
 x: this.x + Math.cos(t) * i,
 y: this.y + Math.sin(t) * i
 }
 },
 draw: function(t) {
 var i = this.ctx;
 i.beginPath(), i.arc(this.x, this.y, this.outerRadius, this.startAngle, this.endAngle), i.arc(this.x, this.y, this.innerRadius, this.endAngle, this.startAngle, !0), i.closePath(), i.strokeStyle = this.strokeColor, i.lineWidth = this.strokeWidth, i.fillStyle = this.fillColor, i.fill(), i.lineJoin = "bevel", this.showStroke && i.stroke()
 }
 }), e.Rectangle = e.Element.extend({
 draw: function() {
 var t = this.ctx,
 i = this.width / 2,
 e = this.x - i,
 s = this.x + i,
 n = this.base - (this.base - this.y),
 o = this.strokeWidth / 2;
 this.showStroke && (e += o, s -= o, n += o), t.beginPath(), t.fillStyle = this.fillColor, t.strokeStyle = this.strokeColor, t.lineWidth = this.strokeWidth, t.moveTo(e, this.base), t.lineTo(e, n), t.lineTo(s, n), t.lineTo(s, this.base), t.fill(), this.showStroke && t.stroke()
 },
 height: function() {
 return this.base - this.y
 },
 inRange: function(t, i) {
 return t >= this.x - this.width / 2 && t <= this.x + this.width / 2 && i >= this.y && i <= this.base
 }
 }), e.Tooltip = e.Element.extend({
 draw: function() {
 var t = this.chart.ctx;
 t.font = M(this.fontSize, this.fontStyle, this.fontFamily), this.xAlign = "center", this.yAlign = "above";
 var i = this.caretPadding = 2,
 e = t.measureText(this.text).width + 2 * this.xPadding,
 s = this.fontSize + 2 * this.yPadding,
 n = s + this.caretHeight + i;
 this.x + e / 2 > this.chart.width ? this.xAlign = "left" : this.x - e / 2 < 0 && (this.xAlign = "right"), this.y - n < 0 && (this.yAlign = "below");
 var o = this.x - e / 2,
 a = this.y - n;
 if (t.fillStyle = this.fillColor, this.custom) this.custom(this);
 else {
 switch (this.yAlign) {
 case "above":
 t.beginPath(), t.moveTo(this.x, this.y - i), t.lineTo(this.x + this.caretHeight, this.y - (i + this.caretHeight)), t.lineTo(this.x - this.caretHeight, this.y - (i + this.caretHeight)), t.closePath(), t.fill();
 break;
 case "below":
 a = this.y + i + this.caretHeight, t.beginPath(), t.moveTo(this.x, this.y + i), t.lineTo(this.x + this.caretHeight, this.y + i + this.caretHeight), t.lineTo(this.x - this.caretHeight, this.y + i + this.caretHeight), t.closePath(), t.fill()
 }
 switch (this.xAlign) {
 case "left":
 o = this.x - e + (this.cornerRadius + this.caretHeight);
 break;
 case "right":
 o = this.x - (this.cornerRadius + this.caretHeight)
 }
 z(t, o, a, e, s, this.cornerRadius), t.fill(), t.fillStyle = this.textColor, t.textAlign = "center", t.textBaseline = "middle", t.fillText(this.text, o + e / 2, a + s / 2)
 }
 }
 }), e.MultiTooltip = e.Element.extend({
 initialize: function() {
 this.font = M(this.fontSize, this.fontStyle, this.fontFamily), this.titleFont = M(this.titleFontSize, this.titleFontStyle, this.titleFontFamily), this.height = this.labels.length * this.fontSize + (this.labels.length - 1) * (this.fontSize / 2) + 2 * this.yPadding + 1.5 * this.titleFontSize, this.ctx.font = this.titleFont;
 var t = this.ctx.measureText(this.title).width,
 i = W(this.ctx, this.font, this.labels) + this.fontSize + 3,
 e = g([i, t]);
 this.width = e + 2 * this.xPadding;
 var s = this.height / 2;
 this.y - s < 0 ? this.y = s : this.y + s > this.chart.height && (this.y = this.chart.height - s), this.x > this.chart.width / 2 ? this.x -= this.xOffset + this.width : this.x += this.xOffset
 },
 getLineHeight: function(t) {
 var i = this.y - this.height / 2 + this.yPadding,
 e = t - 1;
 return 0 === t ? i + this.titleFontSize / 2 : i + (1.5 * this.fontSize * e + this.fontSize / 2) + 1.5 * this.titleFontSize
 },
 draw: function() {
 if (this.custom) this.custom(this);
 else {
 z(this.ctx, this.x, this.y - this.height / 2, this.width, this.height, this.cornerRadius);
 var t = this.ctx;
 t.fillStyle = this.fillColor, t.fill(), t.closePath(), t.textAlign = "left", t.textBaseline = "middle", t.fillStyle = this.titleTextColor, t.font = this.titleFont, t.fillText(this.title, this.x + this.xPadding, this.getLineHeight(0)), t.font = this.font, s.each(this.labels, function(i, e) {
 t.fillStyle = this.textColor, t.fillText(i, this.x + this.xPadding + this.fontSize + 3, this.getLineHeight(e + 1)), t.fillStyle = this.legendColorBackground, t.fillRect(this.x + this.xPadding, this.getLineHeight(e + 1) - this.fontSize / 2, this.fontSize, this.fontSize), t.fillStyle = this.legendColors[e].fill, t.fillRect(this.x + this.xPadding, this.getLineHeight(e + 1) - this.fontSize / 2, this.fontSize, this.fontSize)
 }, this)
 }
 }
 }), e.Scale = e.Element.extend({
 initialize: function() {
 this.fit()
 },
 buildYLabels: function() {
 this.yLabels = [];
 for (var t = v(this.stepValue), i = 0; i <= this.steps; i++) this.yLabels.push(C(this.templateString, {
 value: (this.min + i * this.stepValue).toFixed(t)
 }));
 this.yLabelWidth = this.display && this.showLabels ? W(this.ctx, this.font, this.yLabels) : 0
 },
 addXLabel: function(t) {
 this.xLabels.push(t), this.valuesCount++, this.fit()
 },
 removeXLabel: function() {
 this.xLabels.shift(), this.valuesCount--, this.fit()
 },
 fit: function() {
 this.startPoint = this.display ? this.fontSize : 0, this.endPoint = this.display ? this.height - 1.5 * this.fontSize - 5 : this.height, this.startPoint += this.padding, this.endPoint -= this.padding;
 var t, i = this.endPoint - this.startPoint;
 for (this.calculateYRange(i), this.buildYLabels(), this.calculateXLabelRotation(); i > this.endPoint - this.startPoint;) i = this.endPoint - this.startPoint, t = this.yLabelWidth, this.calculateYRange(i), this.buildYLabels(), t < this.yLabelWidth && this.calculateXLabelRotation()
 },
 calculateXLabelRotation: function() {
 this.ctx.font = this.font;
 var t, i, e = this.ctx.measureText(this.xLabels[0]).width,
 s = this.ctx.measureText(this.xLabels[this.xLabels.length - 1]).width;
 if (this.xScalePaddingRight = s / 2 + 3, this.xScalePaddingLeft = e / 2 > this.yLabelWidth + 10 ? e / 2 : this.yLabelWidth + 10, this.xLabelRotation = 0, this.display) {
 var n, o = W(this.ctx, this.font, this.xLabels);
 this.xLabelWidth = o;
 for (var a = Math.floor(this.calculateX(1) - this.calculateX(0)) - 6; this.xLabelWidth > a && 0 === this.xLabelRotation || this.xLabelWidth > a && this.xLabelRotation <= 90 && this.xLabelRotation > 0;) n = Math.cos(S(this.xLabelRotation)), t = n * e, i = n * s, t + this.fontSize / 2 > this.yLabelWidth + 8 && (this.xScalePaddingLeft = t + this.fontSize / 2), this.xScalePaddingRight = this.fontSize / 2, this.xLabelRotation++, this.xLabelWidth = n * o;
 this.xLabelRotation > 0 && (this.endPoint -= Math.sin(S(this.xLabelRotation)) * o + 3)
 } else this.xLabelWidth = 0, this.xScalePaddingRight = this.padding, this.xScalePaddingLeft = this.padding
 },
 calculateYRange: c,
 drawingArea: function() {
 return this.startPoint - this.endPoint
 },
 calculateY: function(t) {
 var i = this.drawingArea() / (this.min - this.max);
 return this.endPoint - i * (t - this.min)
 },
 calculateX: function(t) {
 var i = (this.xLabelRotation > 0, this.width - (this.xScalePaddingLeft + this.xScalePaddingRight)),
 e = i / (this.valuesCount - (this.offsetGridLines ? 0 : 1)),
 s = e * t + this.xScalePaddingLeft;
 return this.offsetGridLines && (s += e / 2), Math.round(s)
 },
 update: function(t) {
 s.extend(this, t), this.fit()
 },
 draw: function() {
 var t = this.ctx,
 i = (this.endPoint - this.startPoint) / this.steps,
 e = Math.round(this.xScalePaddingLeft);
 this.display && (t.fillStyle = this.textColor, t.font = this.font, n(this.yLabels, function(n, o) {
 var a = this.endPoint - i * o,
 h = Math.round(a),
 l = this.showHorizontalLines;
 t.textAlign = "right", t.textBaseline = "middle", this.showLabels && t.fillText(n, e - 10, a), 0 !== o || l || (l = !0), l && t.beginPath(), o > 0 ? (t.lineWidth = this.gridLineWidth, t.strokeStyle = this.gridLineColor) : (t.lineWidth = this.lineWidth, t.strokeStyle = this.lineColor), h += s.aliasPixel(t.lineWidth), l && (t.moveTo(e, h), t.lineTo(this.width, h), t.stroke(), t.closePath()), t.lineWidth = this.lineWidth, t.strokeStyle = this.lineColor, t.beginPath(), t.moveTo(e - 5, h), t.lineTo(e, h), t.stroke(), t.closePath()
 }, this), n(this.xLabels, function(i, e) {
 var s = this.calculateX(e) + x(this.lineWidth),
 n = this.calculateX(e - (this.offsetGridLines ? .5 : 0)) + x(this.lineWidth),
 o = this.xLabelRotation > 0,
 a = this.showVerticalLines;
 0 !== e || a || (a = !0), a && t.beginPath(), e > 0 ? (t.lineWidth = this.gridLineWidth, t.strokeStyle = this.gridLineColor) : (t.lineWidth = this.lineWidth, t.strokeStyle = this.lineColor), a && (t.moveTo(n, this.endPoint), t.lineTo(n, this.startPoint - 3), t.stroke(), t.closePath()), t.lineWidth = this.lineWidth, t.strokeStyle = this.lineColor, t.beginPath(), t.moveTo(n, this.endPoint), t.lineTo(n, this.endPoint + 5), t.stroke(), t.closePath(), t.save(), t.translate(s, o ? this.endPoint + 12 : this.endPoint + 8), t.rotate(-1 * S(this.xLabelRotation)), t.font = this.font, t.textAlign = o ? "right" : "center", t.textBaseline = o ? "middle" : "top", t.fillText(i, 0, 0), t.restore()
 }, this))
 }
 }), e.RadialScale = e.Element.extend({
 initialize: function() {
 this.size = m([this.height, this.width]), this.drawingArea = this.display ? this.size / 2 - (this.fontSize / 2 + this.backdropPaddingY) : this.size / 2
 },
 calculateCenterOffset: function(t) {
 var i = this.drawingArea / (this.max - this.min);
 return (t - this.min) * i
 },
 update: function() {
 this.lineArc ? this.drawingArea = this.display ? this.size / 2 - (this.fontSize / 2 + this.backdropPaddingY) : this.size / 2 : this.setScaleSize(), this.buildYLabels()
 },
 buildYLabels: function() {
 this.yLabels = [];
 for (var t = v(this.stepValue), i = 0; i <= this.steps; i++) this.yLabels.push(C(this.templateString, {
 value: (this.min + i * this.stepValue).toFixed(t)
 }))
 },
 getCircumference: function() {
 return 2 * Math.PI / this.valuesCount
 },
 setScaleSize: function() {
 var t, i, e, s, n, o, a, h, l, r, c, u, d = m([this.height / 2 - this.pointLabelFontSize - 5, this.width / 2]),
 p = this.width,
 g = 0;
 for (this.ctx.font = M(this.pointLabelFontSize, this.pointLabelFontStyle, this.pointLabelFontFamily), i = 0; i < this.valuesCount; i++) t = this.getPointPosition(i, d), e = this.ctx.measureText(C(this.templateString, {
 value: this.labels[i]
 })).width + 5, 0 === i || i === this.valuesCount / 2 ? (s = e / 2, t.x + s > p && (p = t.x + s, n = i), t.x - s < g && (g = t.x - s, a = i)) : i < this.valuesCount / 2 ? t.x + e > p && (p = t.x + e, n = i) : i > this.valuesCount / 2 && t.x - e < g && (g = t.x - e, a = i);
 l = g, r = Math.ceil(p - this.width), o = this.getIndexAngle(n), h = this.getIndexAngle(a), c = r / Math.sin(o + Math.PI / 2), u = l / Math.sin(h + Math.PI / 2), c = f(c) ? c : 0, u = f(u) ? u : 0, this.drawingArea = d - (u + c) / 2, this.setCenterPoint(u, c)
 },
 setCenterPoint: function(t, i) {
 var e = this.width - i - this.drawingArea,
 s = t + this.drawingArea;
 this.xCenter = (s + e) / 2, this.yCenter = this.height / 2
 },
 getIndexAngle: function(t) {
 var i = 2 * Math.PI / this.valuesCount;
 return t * i - Math.PI / 2
 },
 getPointPosition: function(t, i) {
 var e = this.getIndexAngle(t);
 return {
 x: Math.cos(e) * i + this.xCenter,
 y: Math.sin(e) * i + this.yCenter
 }
 },
 draw: function() {
 if (this.display) {
 var t = this.ctx;
 if (n(this.yLabels, function(i, e) {
 if (e > 0) {
 var s, n = e * (this.drawingArea / this.steps),
 o = this.yCenter - n;
 if (this.lineWidth > 0)
 if (t.strokeStyle = this.lineColor, t.lineWidth = this.lineWidth, this.lineArc) t.beginPath(), t.arc(this.xCenter, this.yCenter, n, 0, 2 * Math.PI), t.closePath(), t.stroke();
 else {
 t.beginPath();
 for (var a = 0; a < this.valuesCount; a++) s = this.getPointPosition(a, this.calculateCenterOffset(this.min + e * this.stepValue)), 0 === a ? t.moveTo(s.x, s.y) : t.lineTo(s.x, s.y);
 t.closePath(), t.stroke()
 }
 if (this.showLabels) {
 if (t.font = M(this.fontSize, this.fontStyle, this.fontFamily), this.showLabelBackdrop) {
 var h = t.measureText(i).width;
 t.fillStyle = this.backdropColor, t.fillRect(this.xCenter - h / 2 - this.backdropPaddingX, o - this.fontSize / 2 - this.backdropPaddingY, h + 2 * this.backdropPaddingX, this.fontSize + 2 * this.backdropPaddingY)
 }
 t.textAlign = "center", t.textBaseline = "middle", t.fillStyle = this.fontColor, t.fillText(i, this.xCenter, o)
 }
 }
 }, this), !this.lineArc) {
 t.lineWidth = this.angleLineWidth, t.strokeStyle = this.angleLineColor;
 for (var i = this.valuesCount - 1; i >= 0; i--) {
 if (this.angleLineWidth > 0) {
 var e = this.getPointPosition(i, this.calculateCenterOffset(this.max));
 t.beginPath(), t.moveTo(this.xCenter, this.yCenter), t.lineTo(e.x, e.y), t.stroke(), t.closePath()
 }
 var s = this.getPointPosition(i, this.calculateCenterOffset(this.max) + 5);
 t.font = M(this.pointLabelFontSize, this.pointLabelFontStyle, this.pointLabelFontFamily), t.fillStyle = this.pointLabelFontColor;
 var o = this.labels.length,
 a = this.labels.length / 2,
 h = a / 2,
 l = h > i || i > o - h,
 r = i === h || i === o - h;
 t.textAlign = 0 === i ? "center" : i === a ? "center" : a > i ? "left" : "right", t.textBaseline = r ? "middle" : l ? "bottom" : "top", t.fillText(this.labels[i], s.x, s.y)
 }
 }
 }
 }
 }), s.addEvent(window, "resize", function() {
 var t;
 return function() {
 clearTimeout(t), t = setTimeout(function() {
 n(e.instances, function(t) {
 t.options.responsive && t.resize(t.render, !0)
 })
 }, 50)
 }
 }()), p ? define(function() {
 return e
 }) : "object" == typeof module && module.exports && (module.exports = e), t.Chart = e, e.noConflict = function() {
 return t.Chart = i, e
 }
 }).call(this),
 function() {
 "use strict";
 var t = this,
 i = t.Chart,
 e = i.helpers,
 s = {
 scaleBeginAtZero: !0,
 scaleShowGridLines: !0,
 scaleGridLineColor: "rgba(0,0,0,.05)",
 scaleGridLineWidth: 1,
 scaleShowHorizontalLines: !0,
 scaleShowVerticalLines: !0,
 barShowStroke: !0,
 barStrokeWidth: 2,
 barValueSpacing: 5,
 barDatasetSpacing: 1,
 legendTemplate: '
<ul class="<%=name.toLowerCase()%>-legend"><% for (var i=0; i<datasets.length; i++){%>
	<li><span style="background-color:<%=datasets[i].fillColor%>"></span><%if(datasets[i].label){%><%=datasets[i].label%><%}%></li>
<%}%></ul>
'
 };
 i.Type.extend({
 name: "Bar",
 defaults: s,
 initialize: function(t) {
 var s = this.options;
 this.ScaleClass = i.Scale.extend({
 offsetGridLines: !0,
 calculateBarX: function(t, i, e) {
 var n = this.calculateBaseWidth(),
 o = this.calculateX(e) - n / 2,
 a = this.calculateBarWidth(t);
 return o + a * i + i * s.barDatasetSpacing + a / 2
 },
 calculateBaseWidth: function() {
 return this.calculateX(1) - this.calculateX(0) - 2 * s.barValueSpacing
 },
 calculateBarWidth: function(t) {
 var i = this.calculateBaseWidth() - (t - 1) * s.barDatasetSpacing;
 return i / t
 }
 }), this.datasets = [], this.options.showTooltips && e.bindEvents(this, this.options.tooltipEvents, function(t) {
 var i = "mouseout" !== t.type ? this.getBarsAtEvent(t) : [];
 this.eachBars(function(t) {
 t.restore(["fillColor", "strokeColor"])
 }), e.each(i, function(t) {
 t.fillColor = t.highlightFill, t.strokeColor = t.highlightStroke
 }), this.showTooltip(i)
 }), this.BarClass = i.Rectangle.extend({
 strokeWidth: this.options.barStrokeWidth,
 showStroke: this.options.barShowStroke,
 ctx: this.chart.ctx
 }), e.each(t.datasets, function(i) {
 var s = {
 label: i.label || null,
 fillColor: i.fillColor,
 strokeColor: i.strokeColor,
 bars: []
 };
 this.datasets.push(s), e.each(i.data, function(e, n) {
 s.bars.push(new this.BarClass({
 value: e,
 label: t.labels[n],
 datasetLabel: i.label,
 strokeColor: i.strokeColor,
 fillColor: i.fillColor,
 highlightFill: i.highlightFill || i.fillColor,
 highlightStroke: i.highlightStroke || i.strokeColor
 }))
 }, this)
 }, this), this.buildScale(t.labels), this.BarClass.prototype.base = this.scale.endPoint, this.eachBars(function(t, i, s) {
 e.extend(t, {
 width: this.scale.calculateBarWidth(this.datasets.length),
 x: this.scale.calculateBarX(this.datasets.length, s, i),
 y: this.scale.endPoint
 }), t.save()
 }, this), this.render()
 },
 update: function() {
 this.scale.update(), e.each(this.activeElements, function(t) {
 t.restore(["fillColor", "strokeColor"])
 }), this.eachBars(function(t) {
 t.save()
 }), this.render()
 },
 eachBars: function(t) {
 e.each(this.datasets, function(i, s) {
 e.each(i.bars, t, this, s)
 }, this)
 },
 getBarsAtEvent: function(t) {
 for (var i, s = [], n = e.getRelativePosition(t), o = function(t) {
 s.push(t.bars[i])
 }, a = 0; a < this.datasets.length; a++)
 for (i = 0; i < this.datasets[a].bars.length; i++)
 if (this.datasets[a].bars[i].inRange(n.x, n.y)) return e.each(this.datasets, o), s;
 return s
 },
 buildScale: function(t) {
 var i = this,
 s = function() {
 var t = [];
 return i.eachBars(function(i) {
 t.push(i.value)
 }), t
 },
 n = {
 templateString: this.options.scaleLabel,
 height: this.chart.height,
 width: this.chart.width,
 ctx: this.chart.ctx,
 textColor: this.options.scaleFontColor,
 fontSize: this.options.scaleFontSize,
 fontStyle: this.options.scaleFontStyle,
 fontFamily: this.options.scaleFontFamily,
 valuesCount: t.length,
 beginAtZero: this.options.scaleBeginAtZero,
 integersOnly: this.options.scaleIntegersOnly,
 calculateYRange: function(t) {
 var i = e.calculateScaleRange(s(), t, this.fontSize, this.beginAtZero, this.integersOnly);
 e.extend(this, i)
 },
 xLabels: t,
 font: e.fontString(this.options.scaleFontSize, this.options.scaleFontStyle, this.options.scaleFontFamily),
 lineWidth: this.options.scaleLineWidth,
 lineColor: this.options.scaleLineColor,
 showHorizontalLines: this.options.scaleShowHorizontalLines,
 showVerticalLines: this.options.scaleShowVerticalLines,
 gridLineWidth: this.options.scaleShowGridLines ? this.options.scaleGridLineWidth : 0,
 gridLineColor: this.options.scaleShowGridLines ? this.options.scaleGridLineColor : "rgba(0,0,0,0)",
 padding: this.options.showScale ? 0 : this.options.barShowStroke ? this.options.barStrokeWidth : 0,
 showLabels: this.options.scaleShowLabels,
 display: this.options.showScale
 };
 this.options.scaleOverride && e.extend(n, {
 calculateYRange: e.noop,
 steps: this.options.scaleSteps,
 stepValue: this.options.scaleStepWidth,
 min: this.options.scaleStartValue,
 max: this.options.scaleStartValue + this.options.scaleSteps * this.options.scaleStepWidth
 }), this.scale = new this.ScaleClass(n)
 },
 addData: function(t, i) {
 e.each(t, function(t, e) {
 this.datasets[e].bars.push(new this.BarClass({
 value: t,
 label: i,
 x: this.scale.calculateBarX(this.datasets.length, e, this.scale.valuesCount + 1),
 y: this.scale.endPoint,
 width: this.scale.calculateBarWidth(this.datasets.length),
 base: this.scale.endPoint,
 strokeColor: this.datasets[e].strokeColor,
 fillColor: this.datasets[e].fillColor
 }))
 }, this), this.scale.addXLabel(i), this.update()
 },
 removeData: function() {
 this.scale.removeXLabel(), e.each(this.datasets, function(t) {
 t.bars.shift()
 }, this), this.update()
 },
 reflow: function() {
 e.extend(this.BarClass.prototype, {
 y: this.scale.endPoint,
 base: this.scale.endPoint
 });
 var t = e.extend({
 height: this.chart.height,
 width: this.chart.width
 });
 this.scale.update(t)
 },
 draw: function(t) {
 var i = t || 1;
 this.clear();
 this.chart.ctx;
 this.scale.draw(i), e.each(this.datasets, function(t, s) {
 e.each(t.bars, function(t, e) {
 t.hasValue() && (t.base = this.scale.endPoint, t.transition({
 x: this.scale.calculateBarX(this.datasets.length, s, e),
 y: this.scale.calculateY(t.value),
 width: this.scale.calculateBarWidth(this.datasets.length)
 }, i).draw())
 }, this)
 }, this)
 }
 })
 }.call(this),
 function() {
 "use strict";
 var t = this,
 i = t.Chart,
 e = i.helpers,
 s = {
 segmentShowStroke: !0,
 segmentStrokeColor: "#fff",
 segmentStrokeWidth: 2,
 percentageInnerCutout: 50,
 animationSteps: 100,
 animationEasing: "easeOutBounce",
 animateRotate: !0,
 animateScale: !1,
 legendTemplate: '
<ul class="<%=name.toLowerCase()%>-legend"><% for (var i=0; i<segments.length; i++){%>
	<li><span style="background-color:<%=segments[i].fillColor%>"></span><%if(segments[i].label){%><%=segments[i].label%><%}%></li>
<%}%></ul>
'
 };
 i.Type.extend({
 name: "Doughnut",
 defaults: s,
 initialize: function(t) {
 this.segments = [], this.outerRadius = (e.min([this.chart.width, this.chart.height]) - this.options.segmentStrokeWidth / 2) / 2, this.SegmentArc = i.Arc.extend({
 ctx: this.chart.ctx,
 x: this.chart.width / 2,
 y: this.chart.height / 2
 }), this.options.showTooltips && e.bindEvents(this, this.options.tooltipEvents, function(t) {
 var i = "mouseout" !== t.type ? this.getSegmentsAtEvent(t) : [];
 e.each(this.segments, function(t) {
 t.restore(["fillColor"])
 }), e.each(i, function(t) {
 t.fillColor = t.highlightColor
 }), this.showTooltip(i)
 }), this.calculateTotal(t), e.each(t, function(t, i) {
 this.addData(t, i, !0)
 }, this), this.render()
 },
 getSegmentsAtEvent: function(t) {
 var i = [],
 s = e.getRelativePosition(t);
 return e.each(this.segments, function(t) {
 t.inRange(s.x, s.y) && i.push(t)
 }, this), i
 },
 addData: function(t, i, e) {
 var s = i || this.segments.length;
 this.segments.splice(s, 0, new this.SegmentArc({
 value: t.value,
 outerRadius: this.options.animateScale ? 0 : this.outerRadius,
 innerRadius: this.options.animateScale ? 0 : this.outerRadius / 100 * this.options.percentageInnerCutout,
 fillColor: t.color,
 highlightColor: t.highlight || t.color,
 showStroke: this.options.segmentShowStroke,
 strokeWidth: this.options.segmentStrokeWidth,
 strokeColor: this.options.segmentStrokeColor,
 startAngle: 1.5 * Math.PI,
 circumference: this.options.animateRotate ? 0 : this.calculateCircumference(t.value),
 label: t.label
 })), e || (this.reflow(), this.update())
 },
 calculateCircumference: function(t) {
 return 2 * Math.PI * (t / this.total)
 },
 calculateTotal: function(t) {
 this.total = 0, e.each(t, function(t) {
 this.total += t.value
 }, this)
 },
 update: function() {
 this.calculateTotal(this.segments), e.each(this.activeElements, function(t) {
 t.restore(["fillColor"])
 }), e.each(this.segments, function(t) {
 t.save()
 }), this.render()
 },
 removeData: function(t) {
 var i = e.isNumber(t) ? t : this.segments.length - 1;
 this.segments.splice(i, 1), this.reflow(), this.update()
 },
 reflow: function() {
 e.extend(this.SegmentArc.prototype, {
 x: this.chart.width / 2,
 y: this.chart.height / 2
 }), this.outerRadius = (e.min([this.chart.width, this.chart.height]) - this.options.segmentStrokeWidth / 2) / 2, e.each(this.segments, function(t) {
 t.update({
 outerRadius: this.outerRadius,
 innerRadius: this.outerRadius / 100 * this.options.percentageInnerCutout
 })
 }, this)
 },
 draw: function(t) {
 var i = t ? t : 1;
 this.clear(), e.each(this.segments, function(t, e) {
 t.transition({
 circumference: this.calculateCircumference(t.value),
 outerRadius: this.outerRadius,
 innerRadius: this.outerRadius / 100 * this.options.percentageInnerCutout
 }, i), t.endAngle = t.startAngle + t.circumference, t.draw(), 0 === e && (t.startAngle = 1.5 * Math.PI), e < this.segments.length - 1 && (this.segments[e + 1].startAngle = t.endAngle)
 }, this)
 }
 }), i.types.Doughnut.extend({
 name: "Pie",
 defaults: e.merge(s, {
 percentageInnerCutout: 0
 })
 })
 }.call(this),
 function() {
 "use strict";
 var t = this,
 i = t.Chart,
 e = i.helpers,
 s = {
 scaleShowGridLines: !0,
 scaleGridLineColor: "rgba(0,0,0,.05)",
 scaleGridLineWidth: 1,
 scaleShowHorizontalLines: !0,
 scaleShowVerticalLines: !0,
 bezierCurve: !0,
 bezierCurveTension: .4,
 pointDot: !0,
 pointDotRadius: 4,
 pointDotStrokeWidth: 1,
 pointHitDetectionRadius: 20,
 datasetStroke: !0,
 datasetStrokeWidth: 2,
 datasetFill: !0,
 legendTemplate: '
<ul class="<%=name.toLowerCase()%>-legend"><% for (var i=0; i<datasets.length; i++){%>
	<li><span style="background-color:<%=datasets[i].strokeColor%>"></span><%if(datasets[i].label){%><%=datasets[i].label%><%}%></li>
<%}%></ul>
'
 };
 i.Type.extend({
 name: "Line",
 defaults: s,
 initialize: function(t) {
 this.PointClass = i.Point.extend({
 strokeWidth: this.options.pointDotStrokeWidth,
 radius: this.options.pointDotRadius,
 display: this.options.pointDot,
 hitDetectionRadius: this.options.pointHitDetectionRadius,
 ctx: this.chart.ctx,
 inRange: function(t) {
 return Math.pow(t - this.x, 2) < Math.pow(this.radius + this.hitDetectionRadius, 2)
 }
 }), this.datasets = [], this.options.showTooltips && e.bindEvents(this, this.options.tooltipEvents, function(t) {
 var i = "mouseout" !== t.type ? this.getPointsAtEvent(t) : [];
 this.eachPoints(function(t) {
 t.restore(["fillColor", "strokeColor"])
 }), e.each(i, function(t) {
 t.fillColor = t.highlightFill, t.strokeColor = t.highlightStroke
 }), this.showTooltip(i)
 }), e.each(t.datasets, function(i) {
 var s = {
 label: i.label || null,
 fillColor: i.fillColor,
 strokeColor: i.strokeColor,
 pointColor: i.pointColor,
 pointStrokeColor: i.pointStrokeColor,
 points: []
 };
 this.datasets.push(s), e.each(i.data, function(e, n) {
 s.points.push(new this.PointClass({
 value: e,
 label: t.labels[n],
 datasetLabel: i.label,
 strokeColor: i.pointStrokeColor,
 fillColor: i.pointColor,
 highlightFill: i.pointHighlightFill || i.pointColor,
 highlightStroke: i.pointHighlightStroke || i.pointStrokeColor
 }))
 }, this), this.buildScale(t.labels), this.eachPoints(function(t, i) {
 e.extend(t, {
 x: this.scale.calculateX(i),
 y: this.scale.endPoint
 }), t.save()
 }, this)
 }, this), this.render()
 },
 update: function() {
 this.scale.update(), e.each(this.activeElements, function(t) {
 t.restore(["fillColor", "strokeColor"])
 }), this.eachPoints(function(t) {
 t.save()
 }), this.render()
 },
 eachPoints: function(t) {
 e.each(this.datasets, function(i) {
 e.each(i.points, t, this)
 }, this)
 },
 getPointsAtEvent: function(t) {
 var i = [],
 s = e.getRelativePosition(t);
 return e.each(this.datasets, function(t) {
 e.each(t.points, function(t) {
 t.inRange(s.x, s.y) && i.push(t)
 })
 }, this), i
 },
 buildScale: function(t) {
 var s = this,
 n = function() {
 var t = [];
 return s.eachPoints(function(i) {
 t.push(i.value)
 }), t
 },
 o = {
 templateString: this.options.scaleLabel,
 height: this.chart.height,
 width: this.chart.width,
 ctx: this.chart.ctx,
 textColor: this.options.scaleFontColor,
 fontSize: this.options.scaleFontSize,
 fontStyle: this.options.scaleFontStyle,
 fontFamily: this.options.scaleFontFamily,
 valuesCount: t.length,
 beginAtZero: this.options.scaleBeginAtZero,
 integersOnly: this.options.scaleIntegersOnly,
 calculateYRange: function(t) {
 var i = e.calculateScaleRange(n(), t, this.fontSize, this.beginAtZero, this.integersOnly);
 e.extend(this, i)
 },
 xLabels: t,
 font: e.fontString(this.options.scaleFontSize, this.options.scaleFontStyle, this.options.scaleFontFamily),
 lineWidth: this.options.scaleLineWidth,
 lineColor: this.options.scaleLineColor,
 showHorizontalLines: this.options.scaleShowHorizontalLines,
 showVerticalLines: this.options.scaleShowVerticalLines,
 gridLineWidth: this.options.scaleShowGridLines ? this.options.scaleGridLineWidth : 0,
 gridLineColor: this.options.scaleShowGridLines ? this.options.scaleGridLineColor : "rgba(0,0,0,0)",
 padding: this.options.showScale ? 0 : this.options.pointDotRadius + this.options.pointDotStrokeWidth,
 showLabels: this.options.scaleShowLabels,
 display: this.options.showScale
 };
 this.options.scaleOverride && e.extend(o, {
 calculateYRange: e.noop,
 steps: this.options.scaleSteps,
 stepValue: this.options.scaleStepWidth,
 min: this.options.scaleStartValue,
 max: this.options.scaleStartValue + this.options.scaleSteps * this.options.scaleStepWidth
 }), this.scale = new i.Scale(o)
 },
 addData: function(t, i) {
 e.each(t, function(t, e) {
 this.datasets[e].points.push(new this.PointClass({
 value: t,
 label: i,
 x: this.scale.calculateX(this.scale.valuesCount + 1),
 y: this.scale.endPoint,
 strokeColor: this.datasets[e].pointStrokeColor,
 fillColor: this.datasets[e].pointColor
 }))
 }, this), this.scale.addXLabel(i), this.update()
 },
 removeData: function() {
 this.scale.removeXLabel(), e.each(this.datasets, function(t) {
 t.points.shift()
 }, this), this.update()
 },
 reflow: function() {
 var t = e.extend({
 height: this.chart.height,
 width: this.chart.width
 });
 this.scale.update(t)
 },
 draw: function(t) {
 var i = t || 1;
 this.clear();
 var s = this.chart.ctx,
 n = function(t) {
 return null !== t.value
 },
 o = function(t, i, s) {
 return e.findNextWhere(i, n, s) || t
 },
 a = function(t, i, s) {
 return e.findPreviousWhere(i, n, s) || t
 };
 this.scale.draw(i), e.each(this.datasets, function(t) {
 var h = e.where(t.points, n);
 e.each(t.points, function(t, e) {
 t.hasValue() && t.transition({
 y: this.scale.calculateY(t.value),
 x: this.scale.calculateX(e)
 }, i)
 }, this), this.options.bezierCurve && e.each(h, function(t, i) {
 var s = i > 0 && i < h.length - 1 ? this.options.bezierCurveTension : 0;
 t.controlPoints = e.splineCurve(a(t, h, i), t, o(t, h, i), s), t.controlPoints.outer.y > this.scale.endPoint ? t.controlPoints.outer.y = this.scale.endPoint : t.controlPoints.outer.y < this.scale.startPoint && (t.controlPoints.outer.y = this.scale.startPoint), t.controlPoints.inner.y > this.scale.endPoint ? t.controlPoints.inner.y = this.scale.endPoint : t.controlPoints.inner.y < this.scale.startPoint && (t.controlPoints.inner.y = this.scale.startPoint)
 }, this), s.lineWidth = this.options.datasetStrokeWidth, s.strokeStyle = t.strokeColor, s.beginPath(), e.each(h, function(t, i) {
 if (0 === i) s.moveTo(t.x, t.y);
 else if (this.options.bezierCurve) {
 var e = a(t, h, i);
 s.bezierCurveTo(e.controlPoints.outer.x, e.controlPoints.outer.y, t.controlPoints.inner.x, t.controlPoints.inner.y, t.x, t.y)
 } else s.lineTo(t.x, t.y)
 }, this), s.stroke(), this.options.datasetFill && h.length > 0 && (s.lineTo(h[h.length - 1].x, this.scale.endPoint), s.lineTo(h[0].x, this.scale.endPoint), s.fillStyle = t.fillColor, s.closePath(), s.fill()), e.each(h, function(t) {
 t.draw()
 })
 }, this)
 }
 })
 }.call(this),
 function() {
 "use strict";
 var t = this,
 i = t.Chart,
 e = i.helpers,
 s = {
 scaleShowLabelBackdrop: !0,
 scaleBackdropColor: "rgba(255,255,255,0.75)",
 scaleBeginAtZero: !0,
 scaleBackdropPaddingY: 2,
 scaleBackdropPaddingX: 2,
 scaleShowLine: !0,
 segmentShowStroke: !0,
 segmentStrokeColor: "#fff",
 segmentStrokeWidth: 2,
 animationSteps: 100,
 animationEasing: "easeOutBounce",
 animateRotate: !0,
 animateScale: !1,
 legendTemplate: '
<ul class="<%=name.toLowerCase()%>-legend"><% for (var i=0; i<segments.length; i++){%>
	<li><span style="background-color:<%=segments[i].fillColor%>"></span><%if(segments[i].label){%><%=segments[i].label%><%}%></li>
<%}%></ul>
'
 };
 i.Type.extend({
 name: "PolarArea",
 defaults: s,
 initialize: function(t) {
 this.segments = [], this.SegmentArc = i.Arc.extend({
 showStroke: this.options.segmentShowStroke,
 strokeWidth: this.options.segmentStrokeWidth,
 strokeColor: this.options.segmentStrokeColor,
 ctx: this.chart.ctx,
 innerRadius: 0,
 x: this.chart.width / 2,
 y: this.chart.height / 2
 }), this.scale = new i.RadialScale({
 display: this.options.showScale,
 fontStyle: this.options.scaleFontStyle,
 fontSize: this.options.scaleFontSize,
 fontFamily: this.options.scaleFontFamily,
 fontColor: this.options.scaleFontColor,
 showLabels: this.options.scaleShowLabels,
 showLabelBackdrop: this.options.scaleShowLabelBackdrop,
 backdropColor: this.options.scaleBackdropColor,
 backdropPaddingY: this.options.scaleBackdropPaddingY,
 backdropPaddingX: this.options.scaleBackdropPaddingX,
 lineWidth: this.options.scaleShowLine ? this.options.scaleLineWidth : 0,
 lineColor: this.options.scaleLineColor,
 lineArc: !0,
 width: this.chart.width,
 height: this.chart.height,
 xCenter: this.chart.width / 2,
 yCenter: this.chart.height / 2,
 ctx: this.chart.ctx,
 templateString: this.options.scaleLabel,
 valuesCount: t.length
 }), this.updateScaleRange(t), this.scale.update(), e.each(t, function(t, i) {
 this.addData(t, i, !0)
 }, this), this.options.showTooltips && e.bindEvents(this, this.options.tooltipEvents, function(t) {
 var i = "mouseout" !== t.type ? this.getSegmentsAtEvent(t) : [];
 e.each(this.segments, function(t) {
 t.restore(["fillColor"])
 }), e.each(i, function(t) {
 t.fillColor = t.highlightColor
 }), this.showTooltip(i)
 }), this.render()
 },
 getSegmentsAtEvent: function(t) {
 var i = [],
 s = e.getRelativePosition(t);
 return e.each(this.segments, function(t) {
 t.inRange(s.x, s.y) && i.push(t)
 }, this), i
 },
 addData: function(t, i, e) {
 var s = i || this.segments.length;
 this.segments.splice(s, 0, new this.SegmentArc({
 fillColor: t.color,
 highlightColor: t.highlight || t.color,
 label: t.label,
 value: t.value,
 outerRadius: this.options.animateScale ? 0 : this.scale.calculateCenterOffset(t.value),
 circumference: this.options.animateRotate ? 0 : this.scale.getCircumference(),
 startAngle: 1.5 * Math.PI
 })), e || (this.reflow(), this.update())
 },
 removeData: function(t) {
 var i = e.isNumber(t) ? t : this.segments.length - 1;
 this.segments.splice(i, 1), this.reflow(), this.update()
 },
 calculateTotal: function(t) {
 this.total = 0, e.each(t, function(t) {
 this.total += t.value
 }, this), this.scale.valuesCount = this.segments.length
 },
 updateScaleRange: function(t) {
 var i = [];
 e.each(t, function(t) {
 i.push(t.value)
 });
 var s = this.options.scaleOverride ? {
 steps: this.options.scaleSteps,
 stepValue: this.options.scaleStepWidth,
 min: this.options.scaleStartValue,
 max: this.options.scaleStartValue + this.options.scaleSteps * this.options.scaleStepWidth
 } : e.calculateScaleRange(i, e.min([this.chart.width, this.chart.height]) / 2, this.options.scaleFontSize, this.options.scaleBeginAtZero, this.options.scaleIntegersOnly);
 e.extend(this.scale, s, {
 size: e.min([this.chart.width, this.chart.height]),
 xCenter: this.chart.width / 2,
 yCenter: this.chart.height / 2
 })
 },
 update: function() {
 this.calculateTotal(this.segments), e.each(this.segments, function(t) {
 t.save()
 }), this.render()
 },
 reflow: function() {
 e.extend(this.SegmentArc.prototype, {
 x: this.chart.width / 2,
 y: this.chart.height / 2
 }), this.updateScaleRange(this.segments), this.scale.update(), e.extend(this.scale, {
 xCenter: this.chart.width / 2,
 yCenter: this.chart.height / 2
 }), e.each(this.segments, function(t) {
 t.update({
 outerRadius: this.scale.calculateCenterOffset(t.value)
 })
 }, this)
 },
 draw: function(t) {
 var i = t || 1;
 this.clear(), e.each(this.segments, function(t, e) {
 t.transition({
 circumference: this.scale.getCircumference(),
 outerRadius: this.scale.calculateCenterOffset(t.value)
 }, i), t.endAngle = t.startAngle + t.circumference, 0 === e && (t.startAngle = 1.5 * Math.PI), e < this.segments.length - 1 && (this.segments[e + 1].startAngle = t.endAngle), t.draw()
 }, this), this.scale.draw()
 }
 })
 }.call(this),
 function() {
 "use strict";
 var t = this,
 i = t.Chart,
 e = i.helpers;
 i.Type.extend({
 name: "Radar",
 defaults: {
 scaleShowLine: !0,
 angleShowLineOut: !0,
 scaleShowLabels: !1,
 scaleBeginAtZero: !0,
 angleLineColor: "rgba(0,0,0,.1)",
 angleLineWidth: 1,
 pointLabelFontFamily: "'Arial'",
 pointLabelFontStyle: "normal",
 pointLabelFontSize: 10,
 pointLabelFontColor: "#666",
 pointDot: !0,
 pointDotRadius: 3,
 pointDotStrokeWidth: 1,
 pointHitDetectionRadius: 20,
 datasetStroke: !0,
 datasetStrokeWidth: 2,
 datasetFill: !0,
 legendTemplate: '
<ul class="<%=name.toLowerCase()%>-legend"><% for (var i=0; i<datasets.length; i++){%>
	<li><span style="background-color:<%=datasets[i].strokeColor%>"></span><%if(datasets[i].label){%><%=datasets[i].label%><%}%></li>
<%}%></ul>
'
 },
 initialize: function(t) {
 this.PointClass = i.Point.extend({
 strokeWidth: this.options.pointDotStrokeWidth,
 radius: this.options.pointDotRadius,
 display: this.options.pointDot,
 hitDetectionRadius: this.options.pointHitDetectionRadius,
 ctx: this.chart.ctx
 }), this.datasets = [], this.buildScale(t), this.options.showTooltips && e.bindEvents(this, this.options.tooltipEvents, function(t) {
 var i = "mouseout" !== t.type ? this.getPointsAtEvent(t) : [];
 this.eachPoints(function(t) {
 t.restore(["fillColor", "strokeColor"])
 }), e.each(i, function(t) {
 t.fillColor = t.highlightFill, t.strokeColor = t.highlightStroke
 }), this.showTooltip(i)
 }), e.each(t.datasets, function(i) {
 var s = {
 label: i.label || null,
 fillColor: i.fillColor,
 strokeColor: i.strokeColor,
 pointColor: i.pointColor,
 pointStrokeColor: i.pointStrokeColor,
 points: []
 };
 this.datasets.push(s), e.each(i.data, function(e, n) {
 var o;
 this.scale.animation || (o = this.scale.getPointPosition(n, this.scale.calculateCenterOffset(e))), s.points.push(new this.PointClass({
 value: e,
 label: t.labels[n],
 datasetLabel: i.label,
 x: this.options.animation ? this.scale.xCenter : o.x,
 y: this.options.animation ? this.scale.yCenter : o.y,
 strokeColor: i.pointStrokeColor,
 fillColor: i.pointColor,
 highlightFill: i.pointHighlightFill || i.pointColor,
 highlightStroke: i.pointHighlightStroke || i.pointStrokeColor
 }))
 }, this)
 }, this), this.render()
 },
 eachPoints: function(t) {
 e.each(this.datasets, function(i) {
 e.each(i.points, t, this)
 }, this)
 },
 getPointsAtEvent: function(t) {
 var i = e.getRelativePosition(t),
 s = e.getAngleFromPoint({
 x: this.scale.xCenter,
 y: this.scale.yCenter
 }, i),
 n = 2 * Math.PI / this.scale.valuesCount,
 o = Math.round((s.angle - 1.5 * Math.PI) / n),
 a = [];
 return (o >= this.scale.valuesCount || 0 > o) && (o = 0), s.distance <= this.scale.drawingArea && e.each(this.datasets, function(t) {
 a.push(t.points[o])
 }), a
 },
 buildScale: function(t) {
 this.scale = new i.RadialScale({
 display: this.options.showScale,
 fontStyle: this.options.scaleFontStyle,
 fontSize: this.options.scaleFontSize,
 fontFamily: this.options.scaleFontFamily,
 fontColor: this.options.scaleFontColor,
 showLabels: this.options.scaleShowLabels,
 showLabelBackdrop: this.options.scaleShowLabelBackdrop,
 backdropColor: this.options.scaleBackdropColor,
 backdropPaddingY: this.options.scaleBackdropPaddingY,
 backdropPaddingX: this.options.scaleBackdropPaddingX,
 lineWidth: this.options.scaleShowLine ? this.options.scaleLineWidth : 0,
 lineColor: this.options.scaleLineColor,
 angleLineColor: this.options.angleLineColor,
 angleLineWidth: this.options.angleShowLineOut ? this.options.angleLineWidth : 0,
 pointLabelFontColor: this.options.pointLabelFontColor,
 pointLabelFontSize: this.options.pointLabelFontSize,
 pointLabelFontFamily: this.options.pointLabelFontFamily,
 pointLabelFontStyle: this.options.pointLabelFontStyle,
 height: this.chart.height,
 width: this.chart.width,
 xCenter: this.chart.width / 2,
 yCenter: this.chart.height / 2,
 ctx: this.chart.ctx,
 templateString: this.options.scaleLabel,
 labels: t.labels,
 valuesCount: t.datasets[0].data.length
 }), this.scale.setScaleSize(), this.updateScaleRange(t.datasets), this.scale.buildYLabels()
 },
 updateScaleRange: function(t) {
 var i = function() {
 var i = [];
 return e.each(t, function(t) {
 t.data ? i = i.concat(t.data) : e.each(t.points, function(t) {
 i.push(t.value)
 })
 }), i
 }(),
 s = this.options.scaleOverride ? {
 steps: this.options.scaleSteps,
 stepValue: this.options.scaleStepWidth,
 min: this.options.scaleStartValue,
 max: this.options.scaleStartValue + this.options.scaleSteps * this.options.scaleStepWidth
 } : e.calculateScaleRange(i, e.min([this.chart.width, this.chart.height]) / 2, this.options.scaleFontSize, this.options.scaleBeginAtZero, this.options.scaleIntegersOnly);
 e.extend(this.scale, s)
 },
 addData: function(t, i) {
 this.scale.valuesCount++, e.each(t, function(t, e) {
 var s = this.scale.getPointPosition(this.scale.valuesCount, this.scale.calculateCenterOffset(t));
 this.datasets[e].points.push(new this.PointClass({
 value: t,
 label: i,
 x: s.x,
 y: s.y,
 strokeColor: this.datasets[e].pointStrokeColor,
 fillColor: this.datasets[e].pointColor
 }))
 }, this), this.scale.labels.push(i), this.reflow(), this.update()
 },
 removeData: function() {
 this.scale.valuesCount--, this.scale.labels.shift(), e.each(this.datasets, function(t) {
 t.points.shift()
 }, this), this.reflow(), this.update()
 },
 update: function() {
 this.eachPoints(function(t) {
 t.save()
 }), this.reflow(), this.render()
 },
 reflow: function() {
 e.extend(this.scale, {
 width: this.chart.width,
 height: this.chart.height,
 size: e.min([this.chart.width, this.chart.height]),
 xCenter: this.chart.width / 2,
 yCenter: this.chart.height / 2
 }), this.updateScaleRange(this.datasets), this.scale.setScaleSize(), this.scale.buildYLabels()
 },
 draw: function(t) {
 var i = t || 1,
 s = this.chart.ctx;
 this.clear(), this.scale.draw(), e.each(this.datasets, function(t) {
 e.each(t.points, function(t, e) {
 t.hasValue() && t.transition(this.scale.getPointPosition(e, this.scale.calculateCenterOffset(t.value)), i)
 }, this), s.lineWidth = this.options.datasetStrokeWidth, s.strokeStyle = t.strokeColor, s.beginPath(), e.each(t.points, function(t, i) {
 0 === i ? s.moveTo(t.x, t.y) : s.lineTo(t.x, t.y)
 }, this), s.closePath(), s.stroke(), s.fillStyle = t.fillColor, s.fill(), e.each(t.points, function(t) {
 t.hasValue() && t.draw()
 })
 }, this)
 }
 })
 }.call(this);
//]]>
</script>
In the first User Macro: radarchart, put this code (with “No Macro body“):
## Macro title: ChartJS: Radar Chart
## Macro body processing: No macro body
##
## Developed by: George Lewe
## Date created: 2015-03-03
## @param ChartID:title=Chart ID|type=string|required=true|desc=Enter a unique (!) identifier for this chart on your page. Use no blanks.|default=MyRadarChart
## @param ChartTitle:title=Chart Title|type=string|required=false|desc=Enter the title of your chart.|default=My Radar Chart
## @param ShowTitle:title=Show Title|type=boolean|desc=Select whether the chart title shall be displayed.|default=true
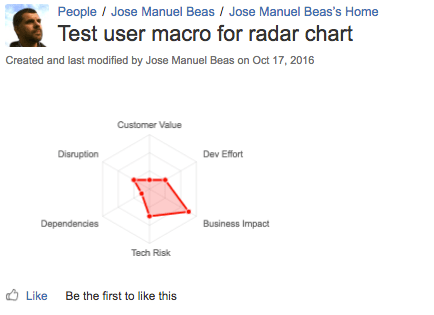
## @param DataLabels:title=Data Labels|type=string|required=true|desc=Enter a comma separated list of your data labels. Make sure you enter as much labels as you enter values below.|default=Apples,Oranges,Bananas,Mangos,Grapes
## @param DataValues:title=Data Values|type=string|required=true|desc=Enter a comma separated list of your data values. Make sure you enter as much values as you enter labels above.|default=18,29,40,34,24
## @param ChartWidth:title=Chart Width|type=string|required=true|desc=Enter the width of your chart in pixels or percent here. The height will be automatically adjusted.|default=500px
## @param ChartColor:title=Chart Color|type=string|required=false|desc=Enter the chart color here in the form of three decimal values for R, G and B separated by a comma.|default=255,100,100
## @param BorderWidth:title=Border Width|type=string|required=false|desc=Enter the width of the chart border followed by 'px'. Enter 0px for no border.|default=1px
## @param BorderColor:title=Border Color|type=string|required=false|desc=Enter the border color as a hex value starting with a hash.|default=#d7d7d7
## @param AngleLineColor:title=Angle Line Color|type=string|required=false|desc=Enter the angle line color here in the form of three decimal values for R, G and B separated by a comma.|default=0,0,0
## @param AngleLineWidth:title=Angle Line Width|type=string|required=false|desc=Enter the pixel width of the angle line.|default=1
## @param ScaleBeginAtZero:title=Begin At Zero|type=boolean|required=false|desc=Select whether the scale should start at zero, or an order of magnitude down from the lowest value.|default=true
## @param AngleShowLineOut:title=Show Angle Line|type=boolean|required=false|desc=Select whether to show the angle lines out of the radar.|default=true
## @param ScaleShowLabels:title=Show Scale Labels|type=boolean|required=false|desc=Select whether to show labels on the scale.|default=false
## @param ScaleShowLine:title=Show Scale Line|type=boolean|required=false|desc=Select whether to show lines for each scale point.|default=true
## @param PointDot:title=Point Dot|type=boolean|required=false|desc=Select whether to show a dot for each point.|default=true
## @param PointDotRadius:title=Point Dot Radius|type=string|required=false|desc=Enter the radius of each point dot in pixels.|default=4
## @param PointDotStrokeWidth:title=Point Dot Stroke Width|type=string|required=false|desc=Enter the pixel width of the point dot stroke.|default=1
## @param PointHitDetectionRadius:title=Point Mouse Over Radius|type=string|required=false|desc=Enter the pixel amount extra to add to the radius to cater for hit detection outside the drawn point.|default=20
## @param DatasetStroke:title=Dataset Stroke|type=boolean|required=false|desc=Select whether to show a stroke for datasets.|default=true
## @param DatasetStrokeWidth:title=Dataset Stroke Width|type=string|required=false|desc=Enter the pixel width of dataset stroke.|default=2
## @param DatasetFill:title=Dataset Fill|type=boolean|required=false|desc=Select whether to fill the dataset with a color.|default=true
<div style="width: $paramChartWidth;">
#if ($paramShowTitle == true)
<div style="text-align: center; font-weight: bold;">$paramChartTitle</div>
#end
<canvas id="$paramChartID" data-charttype="radar" style="border: $paramBorderWidth solid $paramBorderColor; border-radius: 4px; padding: 10px;"></canvas>
</div>
<script type="text/javascript">
//<![CDATA[
var data$paramChartID = {
labels : [
#set ($myLabels=$paramDataLabels.split(","))
#foreach ($item in $myLabels)
"$item",
#end
],
datasets : [
{
fillColor : "rgba($paramChartColor,0.2)",
strokeColor : "rgba($paramChartColor,1)",
pointColor : "rgba($paramChartColor,1)",
pointStrokeColor : "#fff",
pointHighlightFill : "#fff",
pointHighlightStroke : "rgba($paramChartColor,1)",
data : [
#set ($myValues=$paramDataValues.split(","))
#foreach ($item in $myValues)
$item,
#end
]
}
]
}
var options$paramChartID = {
scaleShowLine : #if ($paramScaleShowLine==true) true #else false #end ,
angleShowLineOut : #if ($paramAngleShowLineOut==true) true #else false #end ,
scaleShowLabels : #if ($paramScaleShowLabels==true) true #else false #end ,
scaleBeginAtZero : #if ($paramScaleBeginAtZero==true) true #else false #end ,
angleLineColor : "rgba($paramAngleLineColor,.1)",
angleLineWidth : $paramAngleLineWidth,
pointDot : #if ($paramPointDot==true) true #else false #end ,
pointDotRadius : $paramPointDotRadius,
pointDotStrokeWidth : $paramPointDotStrokeWidth,
pointHitDetectionRadius : $paramPointHitDetectionRadius,
datasetStroke : #if ($paramDatasetStroke==true) true #else false #end ,
datasetStrokeWidth : $paramDatasetStrokeWidth,
datasetFill : #if ($paramDatasetFill==true) true #else false #end ,
responsive : true
}
//]]>
</script>
Finally, create a new page (or edit an exist one) in your test space of Confluence.
And add the Macro of Radarchart and the Macro of ChartsJS


And the final result is….
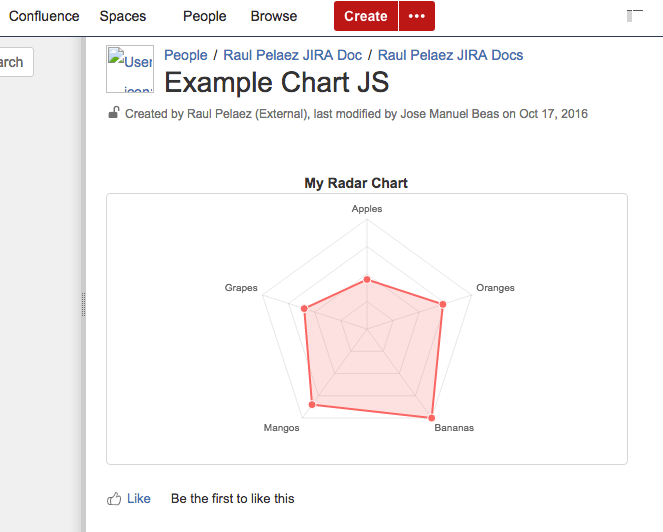
Example: