Good morning my proletarian psychic workers! 🙂
These days I was working analyzing the transactions of my JIRA to get better performance and to solve different problems. Due this, the first thing to do is to find the best tool to analyze all the http/s requests and querys to the database also the external services, the rest api, diverse plugins and, of course, the JVM.
New Relic APM for me is the best tool, very easy to install and in 5 minutes you can see great results! this is amazing! Also we can have X-rays inside all the processes of JIRA… so incredible! … but is a little bit expensive.
Good features for JIRA:
- List of http errors
- Ping service and SLA calculator with good reports, awesome!
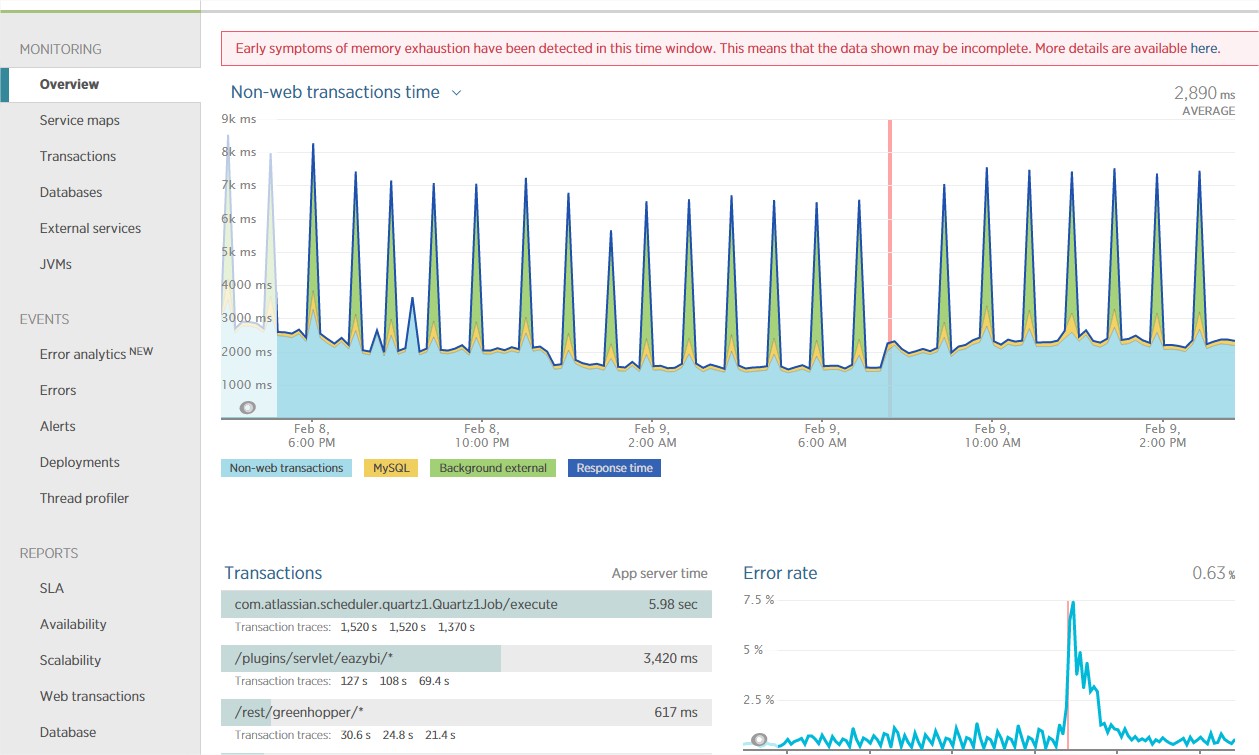
- List & graph of the http transactions and mysql transactions and jvm metrics with timings. graph with different zooms, very useful
- List of the slowest queries, you can resolve Tempo problems with big tasks
- Java metrics, very useful to tuning your JVM, and resolve problems with the Garbage Colector
- External services metrics ( to see connections with bitbucket, atlassian, etc.)
- You can see the detail of each http query, see the mysql transactions and all the timings, yeah!
- Very easy to install!
For me is the best tool of monitoring, what you think? 🙂


